You think you're risking 1% on three different trades? If those trades are correlated, you're actually risking 3% on a single idea in disguise. Position correlation is the sneakiest risk in trading: invisible on each line, devastating at the account level. It's the trap that turns 'clean' management into a sudden blow-up.
- Correlated positions don't diversify: they stack the same risk several times.
- Risk per trade isn't enough: you must look at total risk on one market idea.
- Correlation rises in a crisis: assets that seemed independent fall together at the worst moment.
- The counter is to think in aggregate risk, not isolated trade by trade.
Picture three trades open at once: long EUR/USD, long GBP/USD, short USD/JPY. On paper, three separate positions, each at 1% risk. In reality, three ways to bet the same thing: dollar weakness. If the dollar rises, all three lose together, and your real risk on that idea isn't 1% but 3%.
That's correlation risk: the gap between what you think you're risking (the number on each line) and what you're truly risking (the total exposed to one move). This guide explains how to spot correlated positions, why correlation worsens precisely when you least need it, and how to think in aggregate risk so you never get trapped again.
What position correlation is
Two positions are correlated when they tend to win and lose together. Correlation can be positive (both rise or fall at once, like two dollar-linked pairs) or negative (one rises when the other falls). What matters for your risk is knowing how many of your positions are really a bet on the same underlying factor: an index, a currency, a sector, a commodity.
The trap is that correlation doesn't show on your statement. Each line proudly displays its 1% risk, and you feel diversified. But if all those lines react to the same event, you haven't diversified anything: you've just repeated the same bet disguised under several symbols. The account, meanwhile, feels the total all at once.
The illusion of diversification
Diversification is meant to reduce risk by spreading bets across independent things. But it only works if the bets are truly independent. Opening five strongly correlated positions isn't diversification, it's concentration in disguise. You multiply exposure to one idea while telling yourself you're cautious because you have several positions.
| What you see | What you really risk |
|---|---|
| 3 trades × 1% = '1% each' | Up to 3% on one idea if correlated |
| 5 dollar pairs | One bet: the dollar's direction |
| Long gold + long silver + short dollar | Three expressions of the same theme |
| Several stocks in one sector | A concentrated sector bet |
Real diversification means exposing yourself to different market drivers, not multiplying symbols. Two uncorrelated positions genuinely spread risk; ten correlated positions merely concentrate it while giving the opposite illusion.
Why correlation worsens in a crisis
Here's the worst of it: correlation isn't stable. In normal times, two assets may seem fairly independent. But in periods of market stress, when fear dominates, almost everything becomes correlated. Investors flee risk indiscriminately, and assets that had 'nothing to do' with each other start falling together. The diversification you thought you had vanishes exactly when you'd have needed it.
That's what makes correlation risk so dangerous: it's silent while all is well, then it wakes up all at once on violent days. A portfolio that looked wisely spread can take a brutal aggregate loss during a shock, because all its positions suddenly synchronized to the downside.
How to spot your correlated positions
You don't need complicated statistics to start. A few simple questions unmask most hidden correlations:
- Do my positions share a currency (all in dollars, for example)?
- Are they on instruments in the same sector or the same commodity?
- Would they all react to one event (a central bank decision, an employment number)?
- If a single scenario plays out, how many of my positions lose at the same time?
- Does my total risk on that scenario exceed what I'm willing to lose at once?
If the answer to the last question is yes, you're over-exposed, even if each line respects your 1%. The fix isn't necessarily to close everything, but to reduce the size of each correlated position so the total stays within your limit, or to pick the best expression rather than stacking them all.
Thinking in aggregate risk
The key mindset shift is to stop thinking trade by trade and start thinking in market ideas. Instead of asking 'how much am I risking on this trade?', ask 'how much am I risking on this idea, across all positions?'. Set a risk limit per idea (say 1.5 to 2% maximum on one theme) and split your size accordingly among the positions expressing it.
A trader measures each position's risk. A manager measures the portfolio's risk. The difference shows on the day the market synchronizes everything.
The correlations nobody sees coming
Some correlations are obvious (two dollar pairs), but the most dangerous are the ones you don't suspect. Global stock indices often move together, driven by overall risk sentiment. Commodities share common drivers. Even assets that seem opposite can synchronize during a macro shock, when the only question that matters to the market becomes 'risk or safety'. These hidden correlations don't show on an isolated chart, they reveal themselves at the worst moment, when everything moves the same way.
The classic trap is thinking you're diversifying by trading 'different' markets that actually respond to the same factor. Long a tech index, long a risk currency, short a safe haven: three positions, one bet, the appetite for risk. Until you trace your positions back to their common driver, you can't see you're concentrating instead of spreading. Real diversification requires reasoning in underlying factors, not in symbols.
Correlation and position size
Correlation directly changes how you should size your positions. If you take two uncorrelated trades at 1% each, your real risk on a single scenario stays close to 1%, because they don't necessarily lose together. But if you take two correlated trades at 1% each, your real risk on the adverse scenario approaches 2%, because they lose as a block. Ignoring that means taking twice the risk you think, without noticing.
The practical rule is simple: when you identify several correlated positions, treat them as one position at the risk level. If your limit is 1% per idea, split that 1% across the correlated positions instead of allocating it to each. Concretely, you reduce each line's size so their combined loss, in the scenario where they fall together, stays within your limit. It's the only way to keep real control over your exposure.
Correlation also works in your favor
We always talk about correlation as a danger, but it also has a useful side it would be a shame to ignore. Negatively correlated positions (one rises when the other falls) can serve as a partial hedge, cushioning your losses when a scenario goes wrong. And understanding correlation lets you avoid hedging by accident, by opening two opposite positions on correlated assets that cancel out, leaving you all the cost (spread, fees) with no net exposure.
So the goal isn't to eliminate all correlation, but to know it and use it knowingly. A trader who masters correlation knows when their positions reinforce each other, when they cancel out, and when they stack the same risk. That clarity turns a dangerous blind spot into a management tool, and it's precisely what distinguishes portfolio management from a mere collection of independent trades.
A numeric example of hidden correlation
To make the mechanism concrete, take a purely illustrative example. A trader opens three positions on the same morning: long a US stock index, long bitcoin, short gold. On paper, three different markets, three risk lines at 1% each. But that day, all three positions actually express the same bet: risk appetite. When market sentiment turns optimistic, risky assets like stocks and bitcoin rise together while gold, a safe haven, pulls back. If sentiment reverses during the day, all three positions lose at the same time, at the exact same moment.
The trader who hasn't identified that common thread believes they've diversified their risk across three different ideas, when they've actually concentrated 3% of their capital on a single factor: the day's market sentiment. This kind of correlation doesn't show up in the instrument names, it shows up in what moves them. That's precisely why staying alert to correlation means asking what the underlying driver is before every new position, not just checking that you're trading 'different markets'.
Intraday correlation versus structural correlation
Not all correlations have the same lifespan, and that distinction changes how you should manage them. A structural correlation, like the one between two dollar-sharing pairs, is nearly permanent: it exists almost every day, and you can systematically build it into your sizing. An intraday correlation, on the other hand, shows up occasionally, often triggered by a macro event or a shift in overall sentiment, and disappears once the market has digested the day.
Structural correlations are easier to manage precisely because they're predictable: you can bake them into your sizing rules once and for all. Intraday correlations are more dangerous because they catch you off guard, suddenly linking positions that seemed independent the day before. The counter to this second type is less a fixed rule than a habit of observation: before adding a position to ones already open, ask whether the day's news creates a temporary link between them, even if that link doesn't exist under normal conditions.
Correlation and multi-account trading
If you trade several accounts, correlation isn't limited to your positions inside a single account, it extends across your entire set of accounts. Opening the same trade on three different accounts, each at 1% risk, runs into exactly the same problem as three correlated positions on one account: you think you've tripled your caution by spreading out, when you've simply stacked the same bet three times. Correlation doesn't recognize the boundaries between your accounts, only the underlying market moves.
This dimension is often forgotten because each account separately displays a risk percentage that looks reasonable. The right practice is to reason in aggregate risk across your whole set of accounts, exactly as you would on a single one, the moment you replicate the same idea. The more accounts you manage, the more essential this vigilance becomes, because the temptation to replicate the same good setups everywhere is precisely what makes multi-account trading look efficient while being risky in reality if correlation isn't accounted for.
A simple habit closes most of this gap: before replicating a trade across several accounts, ask how many of them would lose at once if the idea fails, and treat that combined number, not each account's individual line, as your real exposure to manage.
Building the habit of checking correlation
As with many good trading practices, checking correlation only becomes useful once it turns into an automatic reflex, not an occasional check you remember to do sometimes. The best place to build it in is your pre-trade validation process, right after checking your setup and computing your size: a simple question, 'does this position depend on the same factor as a position I already hold?', catches most of the obvious cases before they become a problem.
This reflex is built through repetition, exactly like any other step in your trading checklist. At first, it takes a conscious effort to connect your open positions to their underlying drivers. Over time, that connection becomes instant, almost instinctive, as you learn to recognize the clusters that recur most often in the markets you trade. A trader who has built this reflex never gets blindsided anymore by a cluster of losses they didn't see coming, because they had already spotted it before opening the last position in the group.
Making it visible with Tradoshi
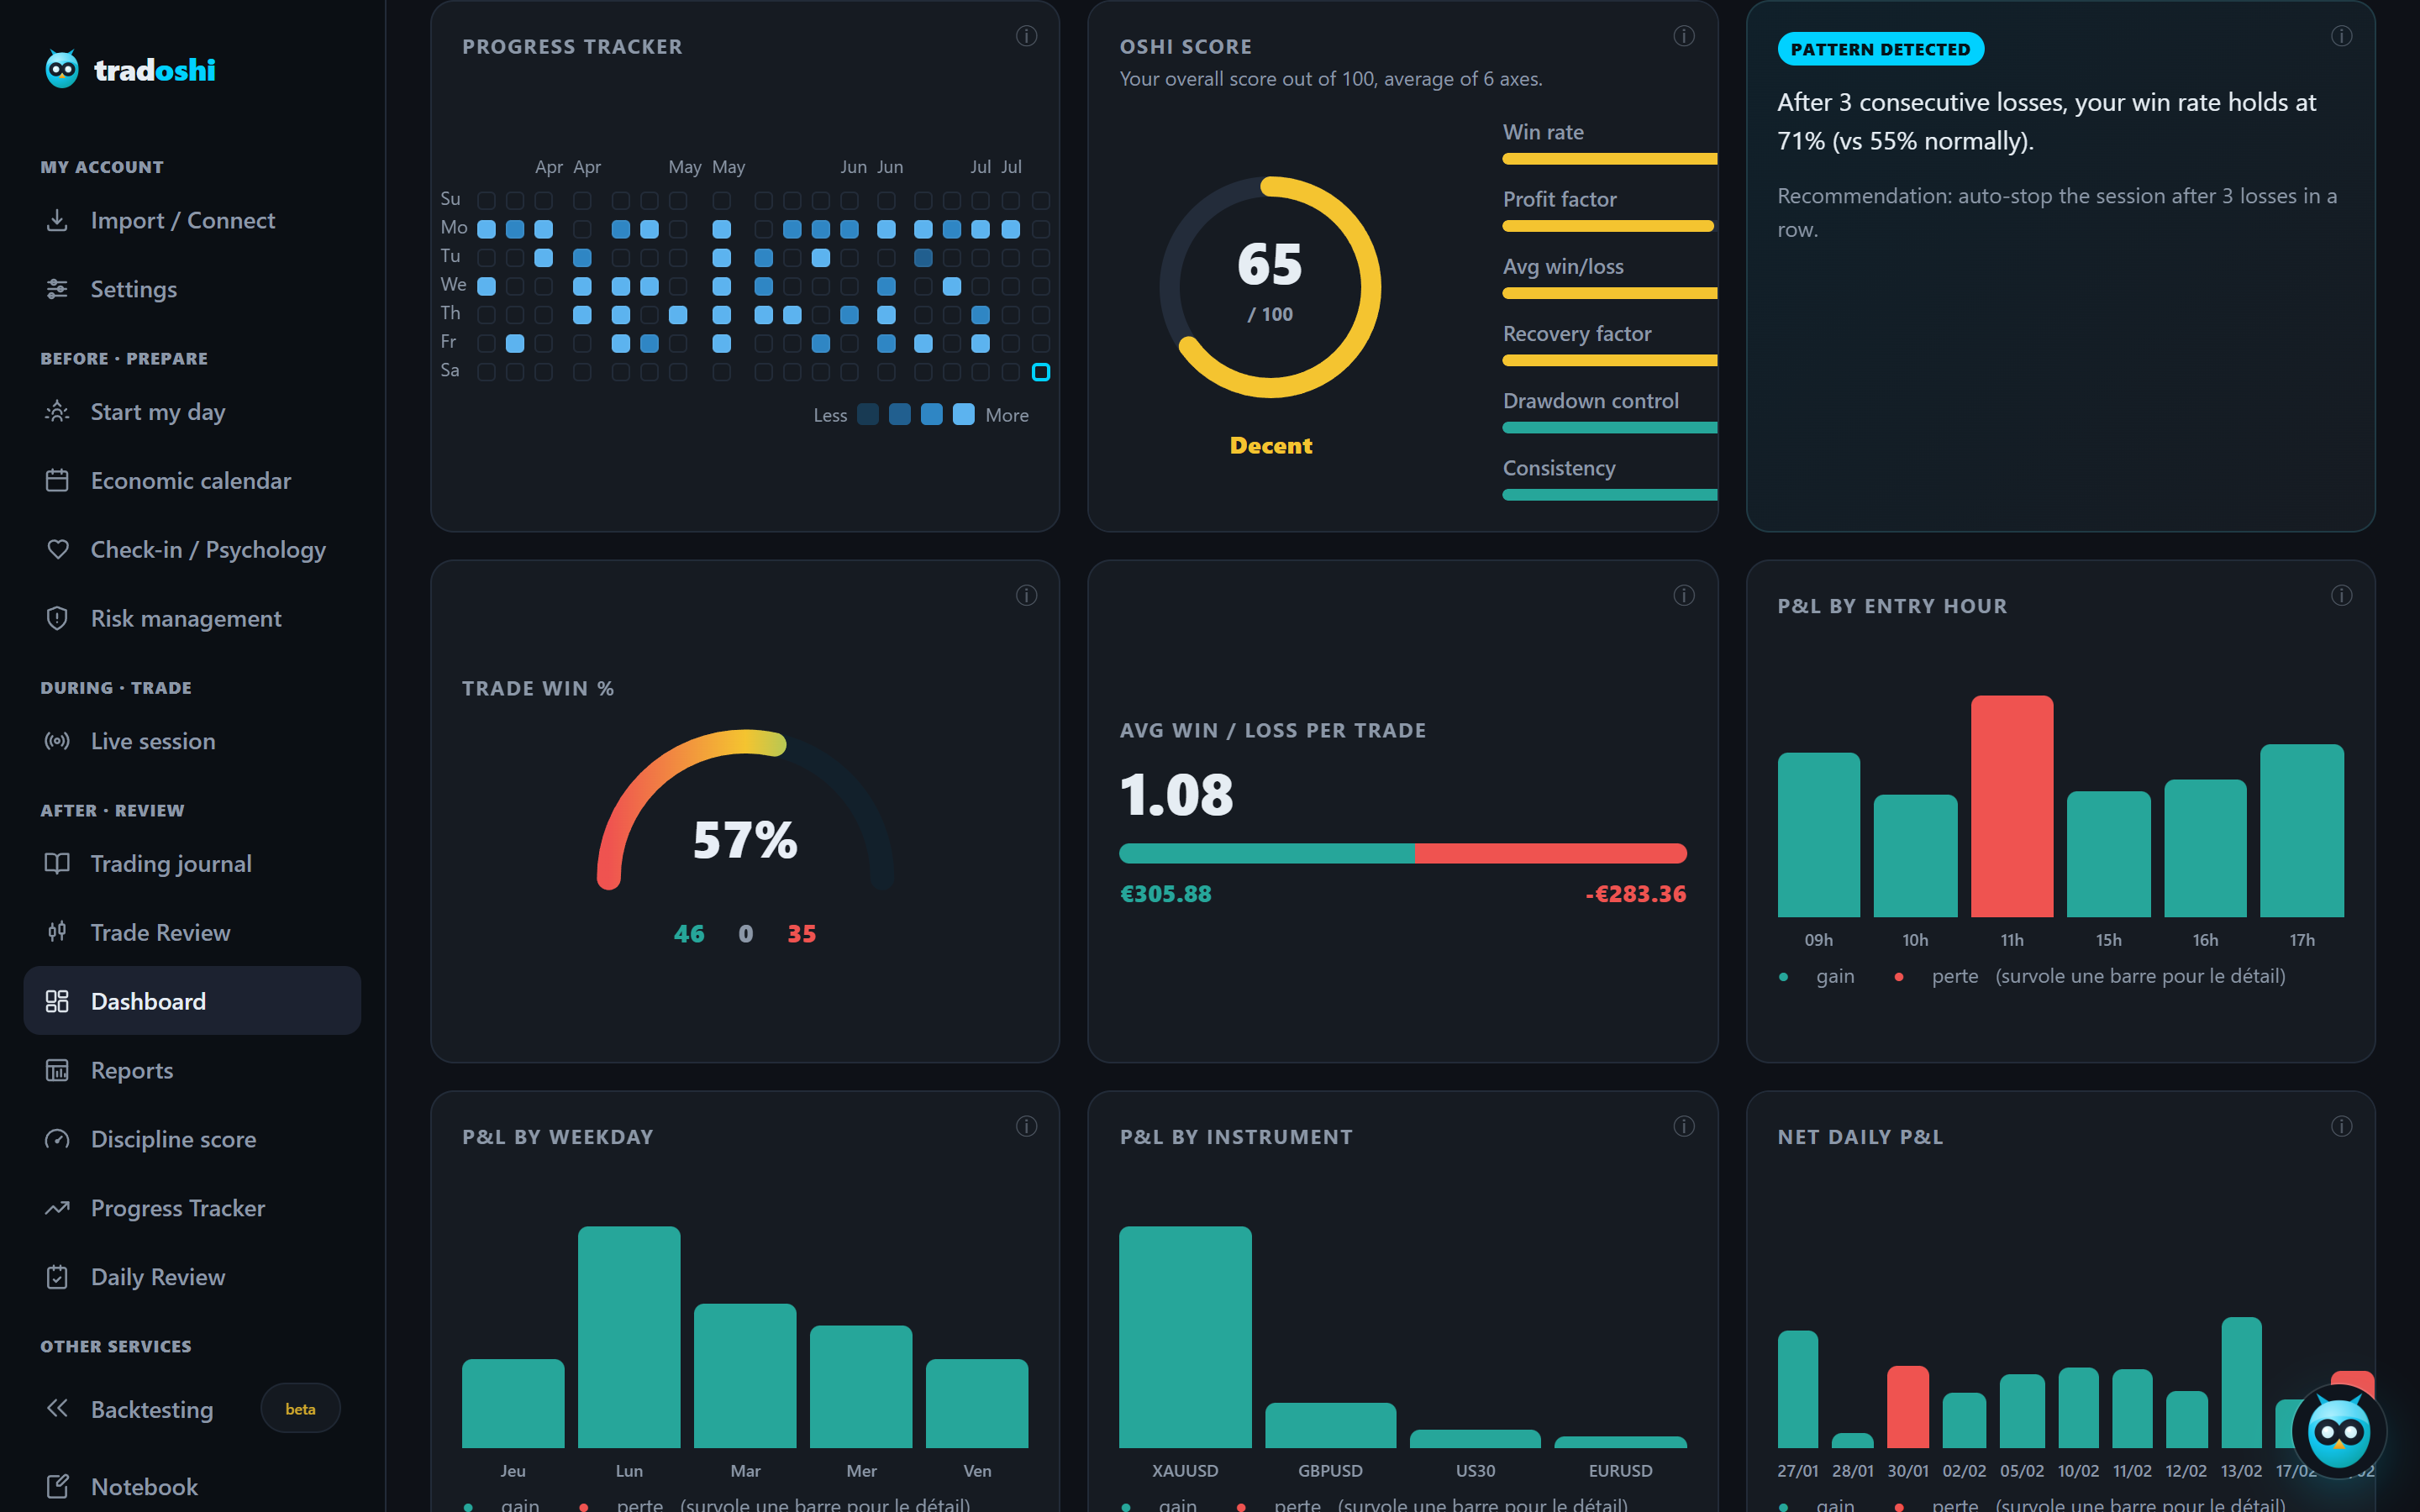
Correlation risk stays invisible as long as you look at your trades one by one. Tradoshi maps your instruments and currencies to help you see when several positions are really betting on the same thing, and to measure your aggregate exposure rather than line by line.
- Instruments and currencies linked: your symbols are tied to their underlying currencies to reveal overlaps.
- Exposure by theme: you see how many of your positions depend on the same market driver.
- Real risk computed: the percentage of capital engaged per trade lets you add up your exposure on an idea.
- Cluster history: days where several correlated positions lost together stand out in your stats.
Frequently asked questions
What is correlation risk in trading?
It's the risk that several of your positions lose at the same time because they depend on one factor (a currency, a sector, a commodity). On paper each trade shows its own risk, but if they all react to the same move, your real risk is the total, not the per-line figure.
How do I know if my positions are correlated?
Ask simple questions: do they share a currency, a sector, a common trigger event? If a single scenario makes several of your positions lose together, they're correlated. You don't need complex statistics at first: common sense about shared drivers unmasks most of it.
Is opening several positions diversifying?
Only if they're truly independent. Multiplying correlated symbols isn't diversification, it's concentration in disguise: you repeat the same bet under several names. Real diversification means exposing yourself to different market drivers, not stacking positions that move together.
Why does correlation rise in a crisis?
Because in stress, investors flee risk indiscriminately. Assets that seemed independent start falling together, and the diversification you thought you had vanishes exactly when you'd have needed it. That's what makes correlation risk so dangerous: it wakes up at the worst moment.
How do I manage correlation risk?
Think in aggregate risk per market idea, not trade by trade. Set a risk limit per theme (say 1.5 to 2% maximum), and if several positions express it, shrink their size so the total stays within that limit, or pick the best expression rather than stacking them all.
Should I avoid correlated positions entirely?
No, that would be excessive. Sometimes it's sensible to express a strong idea through several positions. The problem isn't correlation itself, it's ignoring it: as long as you count your aggregate risk and it stays within your limit, you can do it knowingly. What kills is believing you're diversifying when you're concentrating.
Can a correlation exist one day and not the next?
Yes. Unlike structural correlations (two dollar pairs, nearly permanent), intraday correlations appear occasionally, often due to a macro event or a shift in overall sentiment, then disappear. They're more dangerous because they catch you off guard: ask whether the day's news creates a temporary link between your positions before adding a new one.
Can market sentiment correlate assets that seem unrelated?
Yes, it's one of the most common traps. Assets like stocks, crypto and commodities can all respond to the same factor, risk appetite: they rise or fall together depending on the market's overall mood, even if they appear to have nothing in common. Look at what moves your positions, not just their name.
Does correlation also apply across several trading accounts?
Yes. Replicating the same trade across several accounts runs into the same problem as several correlated positions on one account: you stack the same bet instead of spreading it. Before replicating an idea across several accounts, count how many would lose at once if it fails, and treat that total as your real exposure.