If you had to track just one number in all your trading, it wouldn't be your gain, it would be your maximum drawdown. It measures the worst pain your strategy has already inflicted, determines whether you can sleep at night, and predicts whether you'll survive your next bad patch. Yet almost nobody truly looks at it.
- Maximum drawdown is the biggest drop in your capital from a peak, as a percentage.
- It measures real risk better than return: two strategies with the same gain can have opposite pain.
- It predicts your survival: a drawdown you can't bear will make you quit at the worst moment.
- It's used to compare, to size, and to know when a system leaves its normal behavior.
Most traders judge a strategy on one question: how much it makes. That's the worst way to judge it. Two systems showing the same annual return can have radically different risk profiles: one gave you a calm 8% drop, the other a 45% chasm that made you want to quit everything. The return is identical, the experience is incomparable.
Maximum drawdown is the number that reveals this difference. It tells you the worst your strategy has put you through, and therefore what it could put you through again. This guide explains what it measures exactly, why it's more honest than return, and how to use it to compare systems, size your risk and detect drift. If the very idea of a drawdown is still fuzzy, lay the groundwork first with understanding and surviving your dips.
What maximum drawdown measures
Maximum drawdown is the largest fall your capital suffered between a peak and the trough that followed, before making a new peak. If your account rose to 12,000, dropped to 9,000 then recovered, your maximum drawdown over that period is 25%. It isn't the loss of an isolated trade, it's the depth of the worst hole your capital curve went through, measured peak to trough.
This number is precious because it captures something neither total gain nor win rate shows: the amplitude of the suffering. Two curves that end in the same place can have completely different lived experiences, and it's maximum drawdown that puts that experience into a number. It answers the only question that really counts in hard moments: how far down can it go? It's also the only number that tells you, before you even start, what you must be ready to absorb in order to hope for the displayed return.
Why it's more honest than return
Return is the number everyone highlights, precisely because it flatters. But a return without its drawdown is a half-truth, often misleading. A system that makes 40% a year while suffering a 50% drawdown is far more dangerous than one that makes 20% with a 10% drawdown, even if the first 'makes more'. The first can ruin you or make you crack before you reap; the second is livable.
| System | Annual return | Max drawdown | Return/risk ratio |
|---|---|---|---|
| A | 40% | 50% | 0.8: poor |
| B | 20% | 10% | 2.0: excellent |
| C | 30% | 15% | 2.0: excellent |
| D | 60% | 70% | 0.86: trap |
Look at the last column: it relates return to drawdown, and it upends the ranking. System D, the most profitable in appearance, is actually a trap: its drawdown is so deep that very few traders would bear it without quitting. Return alone lies; related to drawdown, it tells the truth.
It predicts your psychological survival
Maximum drawdown isn't just a statistic, it's a psychological test. A system with a 40% drawdown may exist on paper, but can you actually live it? Can you watch your capital melt by nearly half without deviating from your plan, without cutting at the worst moment, without doubling to win it back? Most traders say yes in theory and quit in practice, right before the recovery.
A drawdown you can't bear emotionally is a drawdown that will make you quit at the worst moment. The best system is the one you can actually hold.
That's why you should choose a system whose maximum drawdown stays in your real comfort zone, not your theoretical one. A slightly less profitable system that you hold is infinitely better than a brilliant one you'll abandon in pain. The performance that counts is the one you actually capture, not the one that exists on a backtest you didn't have the nerve to follow. A system you abandon halfway through is worth nothing, however brilliant it looks on paper.
Three concrete uses
Maximum drawdown isn't just an indicator to contemplate, it's a decision tool. Here's how to use it:
- Compare: always put return next to drawdown to judge a system, never return alone.
- Size: if the historical drawdown feels too painful, reduce your position size to bring it back into your comfort zone.
- Detect drift: when your drawdown clearly exceeds its historical maximum, it's a sign your system is broken or you're no longer following it.
This last use is the most underrated. Your historical maximum drawdown defines a boundary: as long as you stay inside it, you're in your system's normal behavior. The day you clearly cross it, it's no longer ordinary variance, it's an alarm that calls for stopping and understanding what changed.
Maximum drawdown and prop firms
If you trade for a prop firm, maximum drawdown is no longer just an indicator, it's a hard rule. Most evaluations impose a maximum total drawdown (often 10%) beyond which the account is lost, permanently. Knowing and monitoring your drawdown in real time then becomes a matter of account survival, not just comfort. A system whose historical drawdown grazes the prop firm's limit is a system that will make you fail sooner or later.
The Calmar ratio: linking return and drawdown
Since maximum drawdown is never read alone, there's a simple indicator that links it directly to your performance: the ratio between your return and your maximum drawdown (sometimes called the Calmar ratio). It answers the real question, the one return alone never asks: how much pain did I have to endure to get this gain? A system that makes 30% with 15% drawdown (ratio 2.0) is far superior to one that makes 30% with 40% drawdown (ratio 0.75), even if their displayed return is identical.
This indicator is precious because it rewards efficiency, not risk-taking. Two traders with the same return aren't equal if one got it calmly and the other on the edge of ruin. By systematically relating your return to your maximum drawdown, you judge your systems and periods on the right dimension, and you stop being seduced by flattering performances that hide unbearable risk. It's the number that turns 'how much I made' into 'at what price'.
Set your acceptable maximum drawdown in advance
Maximum drawdown isn't only an after-the-fact observation, it can and should become a decision made in advance. Even before starting a trading period, set the drawdown you refuse to exceed, the one beyond which you stop to reassess everything. That threshold, decided cold, becomes a safeguard that stops you from letting a bad patch turn into a disaster, because it takes the stop decision away from your in-the-moment emotional self.
Without this pre-decided threshold, you'll always let emotion decide when to stop, i.e. too late, when the hole is already deep and panic commands. With it, you have a clear line: as long as you're above, you continue normally; if you reach it, you stop, reduce your size or take a break, no negotiation. This single number, chosen in calm, is one of the most effective safeguards against the scenario where a normal drawdown drifts into ruin.
Maximum drawdown and confidence in your system
Knowing your system's historical maximum drawdown has a major psychological benefit: it tells you what to expect, and therefore spares you from panicking when it happens. If you know your system has already gone through 12% drawdowns, then an 8% drop doesn't surprise you and doesn't call your system into question: you're still in its normal behavior. It's that knowledge that lets you hold your plan where a trader ignorant of their drawdown would panic.
Conversely, a drawdown clearly exceeding your worst historical trough is precious information: it's the signal that something has changed, either in the market or in your execution. Your maximum drawdown thus acts as a boundary between normal and abnormal. As long as you stay inside it, you trust your system; when you clearly cross it, you stop to understand. That boundary turns a diffuse emotion ('things are going badly') into an objective, actionable signal.
The mathematical wall of recovery
Drawdown has a brutal mathematical property many traders underestimate: the deeper it gets, the more disproportionately the gain needed to return to the previous peak grows. This asymmetry isn't an opinion, it's a plain consequence of percentage arithmetic.
| Drawdown taken | Gain needed to recover |
|---|---|
| 10% | 11% |
| 20% | 25% |
| 30% | 43% |
| 50% | 100% |
| 80% | 400% |
This reality completely changes how you should view risk: each extra percentage point of drawdown doesn't cost linearly more to recover, it costs exponentially more. That's the mathematical reason, beyond psychology, why limiting the depth of your troughs matters more than maximizing your gains during the good stretches. A trader who avoids big drawdowns protects something far more valuable than emotional comfort: they protect their arithmetic ability to get back to positive territory within a reasonable time.
A worked example: calculating your own drawdown
Take a purely illustrative example. Your account, starting at 10,000, climbs gradually to 14,000 over several weeks: that's your new peak. Then a string of losses brings it down to 11,200, before it turns back up. Your drawdown on that episode is calculated simply: (14,000 - 11,200) / 14,000, or 20%. It doesn't matter that your account is still above your starting capital (10,000): what matters for drawdown is the drop from the peak, not from the starting point.
This distinction often surprises beginning traders, who confuse 'I'm still up relative to my initial deposit' with 'I have no drawdown'. The two are independent. You can show a nice net gain for the year while having gone through a severe drawdown in the middle, and it's precisely that intermediate drawdown, not the final result, that measures the real pain you had to absorb to get there.
Current drawdown vs maximum drawdown: the difference that matters
Your current drawdown, the one you're living right now, and your system's historical maximum drawdown are two different numbers you should never confuse. The first moves constantly, minute by minute if you're watching your floating equity; the second is a fixed record, set once and for all by the worst episode your strategy has been through so far. Tracking only the second without monitoring the first in real time is like driving while only watching the total odometer, never the road ahead.
The right habit is to track both in parallel: your current drawdown tells you where you stand right now, your historical maximum tells you what's normal for your system and where the line sits beyond which you should worry. A current drawdown of 15% doesn't mean the same thing depending on whether your historical maximum is 12% (you're already in uncharted territory) or 25% (you're still within ordinary variance). It's the comparison between the two, not either one in isolation, that gives you useful information.
Tracking it with Tradoshi
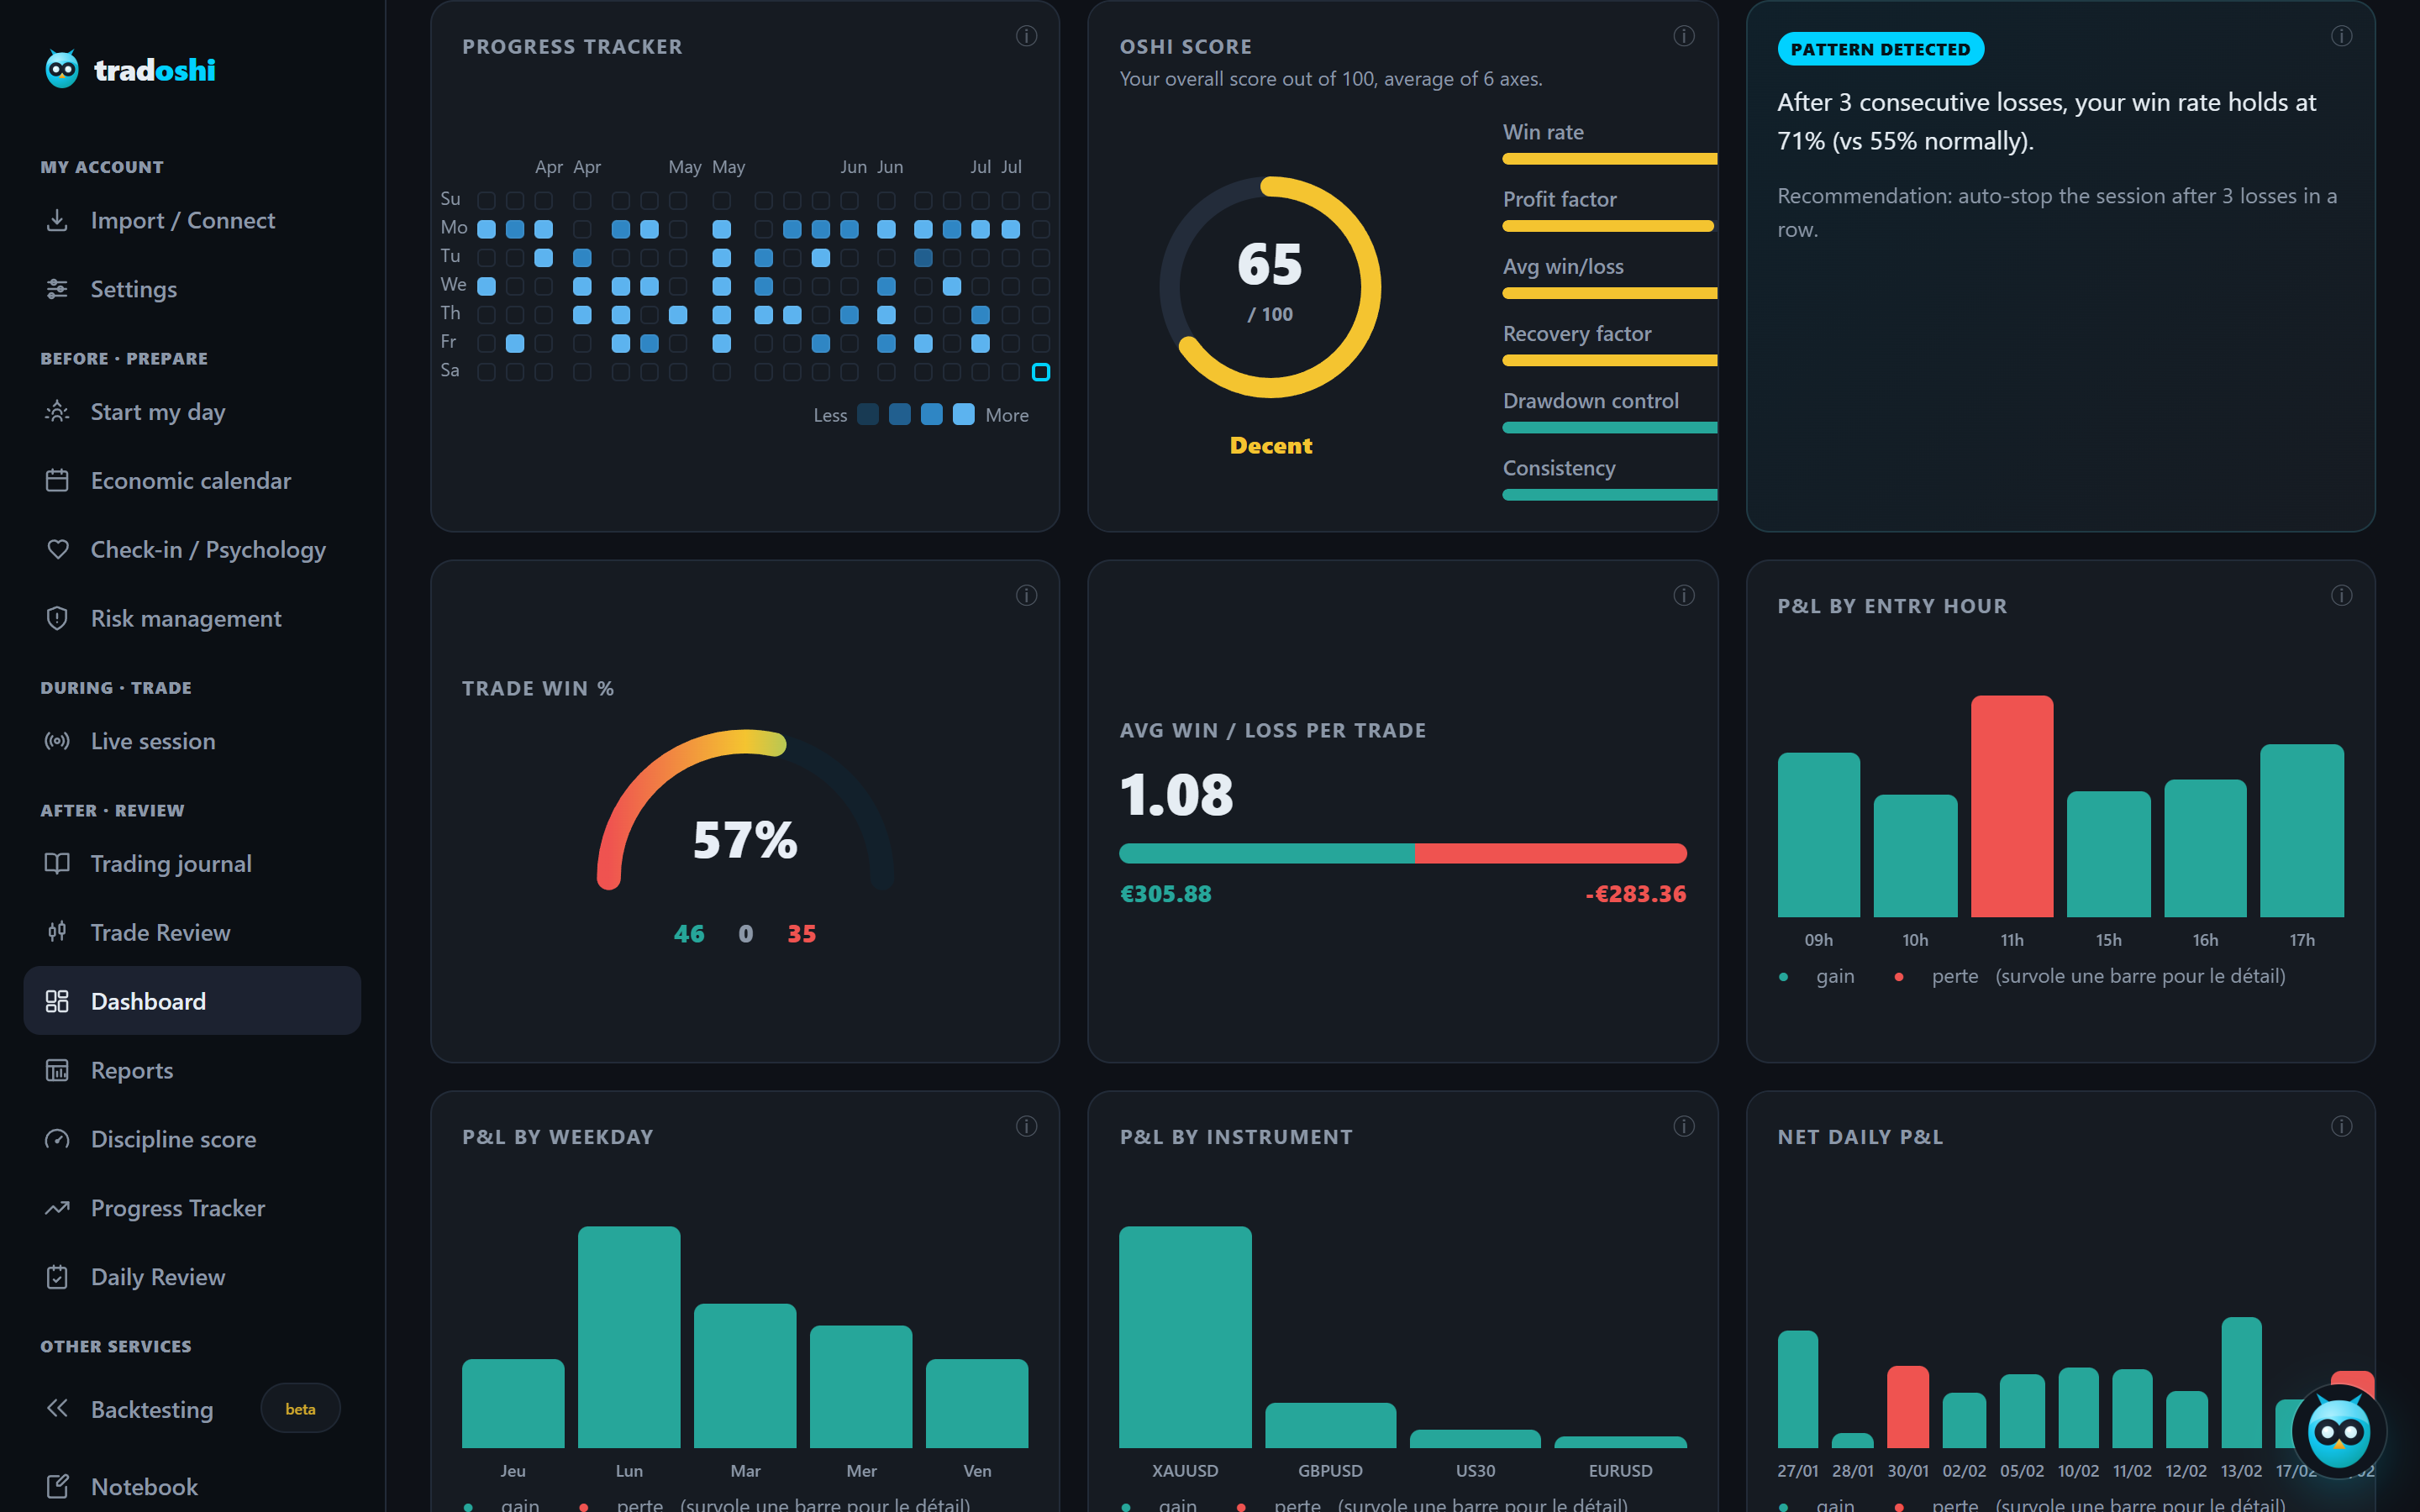
Tradoshi computes your current and maximum drawdown continuously, and turns your ability to avoid digging big holes into a scored axis of your Oshi Score. You see at a glance where you stand relative to your worst historical trough and your accounts' limits.
- Current and maximum drawdown: displayed continuously, on each connected account.
- Drawdown mastery: an axis of the Oshi Score rates your ability to limit the depth of your troughs.
- Prop firm alert: your drawdown is tracked against your funded accounts' rules.
- Drift detection: a drawdown exceeding your usual maximum stands out as a strong signal.
Frequently asked questions
What is maximum drawdown?
It's the biggest drop in your capital between a peak and the trough that followed, expressed as a percentage. If your account rises to 12,000, drops to 9,000 then recovers, your maximum drawdown is 25%. It isn't a trade's loss, it's the depth of the worst hole your capital curve went through.
Why is maximum drawdown so important?
Because it measures real risk far better than return. Two systems with the same annual gain can have opposite drawdowns, and therefore incomparable experiences. Maximum drawdown tells you the worst pain already suffered, predicts your ability to survive, and reveals whether a flattering return hides an unbearable risk.
How do I compare two strategies with drawdown?
Never look at return alone: relate it to maximum drawdown. A system at 20% gain for 10% drawdown (ratio 2.0) is far better than one at 40% gain for 50% drawdown (ratio 0.8), even if the second 'makes more'. Return related to risk tells the truth that return alone hides.
What maximum drawdown is acceptable?
It depends on your real tolerance, not your theoretical one. Many traders aim to stay under 15-20%. The key is choosing a system whose drawdown you can actually bear emotionally: a drawdown you can't hold will make you quit at the worst moment, right before the recovery. The best system is the one you can truly hold.
How do I use drawdown to size my risk?
If your system's historical drawdown feels too painful, reduce your position size: it lowers the drawdown proportionally. Halving your risk per trade roughly halves your drawdown. You trade a little return for a curve you can actually follow without cracking.
Is a drawdown exceeding my record serious?
It's an important alarm. Your historical maximum drawdown defines the boundary of your system's normal behavior. As long as you stay inside it, it's ordinary variance. When you clearly cross it, it's no longer bad luck: either your system is broken, or you're no longer following it. Either way, stop and understand before continuing.
Why is a 50% drawdown so dangerous?
Because of the mathematical asymmetry of recovery: a 50% loss needs a 100% gain just to get back to the previous level, a full doubling of the remaining capital. The deeper the drawdown, the more disproportionately, not linearly, the gain needed to erase it grows. That's the arithmetic reason, beyond psychology, why limiting the depth of your troughs matters more than maximizing your gains.
Is drawdown calculated from my initial deposit?
No, that's a common confusion. Drawdown is calculated from the last peak your capital reached, not from your starting deposit. You can show a positive net gain for the year while having gone through a severe drawdown in the middle: the two numbers are independent, and it's the intermediate drawdown that measures the real pain endured.