Analyzing your trading performance isn't looking at your P&L. It's understanding where your gains and losses really come from, through a set of indicators and breakdowns that turn a mass of trades into clear lessons. Most traders never do this analysis, and stay blind to what makes them win or lose. This guide explains how to analyze your performance completely and usefully.
- Analyzing isn't looking at your P&L: it's understanding where your results come from.
- A few key indicators suffice: win rate, profit factor, expectancy, drawdown, average R.
- Breakdowns reveal the why: by time, instrument, setup and emotion.
- Analysis leads to action: repeat what works, cut what loses.
Many traders confuse looking at their balance with analyzing their performance. The balance tells you where you stand, but nothing about why. To progress, you need to understand the causes of your results: which indicators reveal your trading's health, where your gains come from, where your leaks are. This understanding separates the trader who improves from the one who repeats the same mistakes.
Analyzing your performance isn't reserved for professionals and doesn't require complex spreadsheets. With a handful of well-chosen indicators and a few relevant breakdowns, you get a clear picture of your trading. This guide gives you the method: which indicators to watch, how to interpret them, and how to turn this analysis into concrete decisions. It all starts with the raw material: without trades recorded properly there is nothing to analyse, and that is the job of a free trading journal that fills itself from your broker instead of being typed in by hand.
P&L isn't enough
Every trader's first reflex is to look at their P&L, and that's normal, but it's insufficient. P/L, P&L and PnL are three spellings of the same number, and none of them says why. The P&L is an overall result that hides everything that matters: it doesn't tell you whether you win from your edge or by luck, whether your performance is steady or carried by a few shots, or where your leaks are. Settling for the P&L is like judging an engine by the sound it makes alone.
Analyzing means opening the hood. It's breaking down this overall result into its causes, to understand not just how much you win or lose, but why. This shift from result to causes is the heart of performance analysis, and it's what makes improvement possible. You can only act on what you understand, and the P&L alone can't be understood. Two traders can post the same balance at month's end while running radically different trading, one solid and reproducible, the other fragile and lucky, and only analysis tells you which side you're actually on.
The indicators that count
A good analysis rests on a few well-chosen indicators, not an avalanche of numbers. The most useful count on one hand: the win rate (your win frequency), the profit factor (your total gains divided by your losses), the expectancy (your average gain per trade), the maximum drawdown (your worst drop) and the average R (your average gain in units of risk). Together, they paint a complete portrait of your trading.
| Indicator | What it tells you |
|---|---|
| Win rate | How often you win |
| Profit factor | Whether your system is profitable and how much |
| Expectancy | What each trade returns on average |
| Max drawdown | Your worst drop, your risk resistance |
| Average R | Your performance in units of risk |
These indicators are read together, never in isolation. A good win rate means nothing if the profit factor is bad; a high profit factor on a small sample isn't reliable; a huge drawdown can threaten an otherwise profitable system. It's the combination of these numbers that gives the true portrait, and learning to read them together is the first skill of performance analysis.
Breakdowns reveal the why
Global indicators tell you the general health of your trading, but not where your results come from. For that, you must break down: look at your statistics by time of day, by day, by instrument, by setup and by emotional state. These breakdowns surface the concrete sources of your gains and losses, invisible in the global numbers.
It's in the breakdowns that the most actionable lessons hide. Discovering that an instrument systematically loses for you, that a time window concentrates your best trades, or that a degraded emotional state coincides with your worst days gives you precise action levers. Analysis by global indicators tells you whether you're doing well or badly; analysis by breakdowns tells you why and where to act.
Consistency and distribution
Beyond averages, a good analysis looks at the consistency and distribution of your results. Two traders with the same P&L can have opposite profiles: one wins small amounts steadily, the other depends on rare big gains that mask many losses. The first has solid trading, the second fragile trading, and this crucial difference only appears if you look beyond the average.
Analyzing the distribution of your trades and days tells you where your performance really comes from. If all your gain comes from one or two exceptional trades, your profitability is fragile and depends on the luck of finding these shots again. If it comes from a steady flow of small gains, it's robust and reproducible. Understanding this dimension changes how you manage your risk and judge the solidity of your edge.
From analysis to action
An analysis that leads to nothing is useless. The goal isn't to contemplate numbers, but to draw concrete decisions from them. Each analysis should conclude with one or two clear actions: repeat a winning pattern more, cut a losing one, adjust a failing component. It's this move to action that turns analysis into progress.
The finest analysis is worth nothing if it doesn't change a single one of your behaviors. The goal isn't to understand for the sake of understanding, but to understand in order to act.
To be effective, this action must stay targeted: better a single well-applied change than ten vague resolutions. Analysis gives you the map, but it's action, one at a time, verified at the next analysis, that moves you forward. It's this loop, analyze, act, re-measure, that constitutes the real engine of progress, far more than the passive accumulation of statistics.
Analyze regularly, not once
Performance analysis only has value if it's regular. A one-off analysis gives a snapshot at a given moment, but it's tracking over time that reveals trends: is your edge strengthening or degrading, are your corrections bearing fruit, is a new problem appearing? Without regularity, you don't see these evolutions, and you always react too late.
Integrating analysis into a routine, a weekly review for example, turns a one-off exercise into a continuous steering tool. You see your numbers evolve, compare periods, measure the effect of your adjustments. This regularity is what separates the trader who steers their progress from the one who suffers their results. Analysis isn't an exceptional audit, it's a background habit.
A worked example to understand expectancy
Take an illustrative example to understand why expectancy matters more than win rate alone. Imagine a trader with a 40% win rate: they lose six trades out of ten. If they risk 1R per trade, average 3R on winners and lose 1R on losers, their expectancy is: (0.4 x 3R) minus (0.6 x 1R), which is 1.2R minus 0.6R, an expectancy of +0.6R per trade. This trader loses more often than they win, and yet they're solidly profitable over time.
Conversely, imagine a second trader with a flattering 70% win rate, but who averages 0.5R on winners and loses 1.5R on losers. Their expectancy becomes: (0.7 x 0.5R) minus (0.3 x 1.5R), which is 0.35R minus 0.45R, a negative expectancy of -0.1R per trade. This second trader feels like a winner far more often, yet loses money over time. This example illustrates why focusing on win rate alone, without crossing it with the average-gain-to-average-loss ratio, leads to misleading conclusions about a strategy's real quality.
Compare your periods rather than compare yourself to others
Useful analysis happens over time, not just at a single moment. Compare your current month to your previous month, your quarter to the one before, rather than measuring yourself against an outside number or a performance other traders display. Your own trajectory is what tells you whether you're progressing, stagnating or regressing, and it's the only comparison that's truly actionable, because you control the levers of your own evolution, not someone else's.
This across-time comparison reveals things a single snapshot never shows: a profit factor slowly improving despite a choppy P&L, a maximum drawdown shrinking trade after trade, or conversely a gradual degradation that would go unnoticed if you only looked at the account balance. Setting up this periodic tracking, even a simple one, turns analysis from a one-off exercise into a real steering tool for your progress.
Interpretation traps to avoid
Analyzing your performance carries its own traps. The first is over-interpreting a small sample: ten or twenty trades are almost never enough to draw a reliable conclusion, even if the numbers seem telling. The second is confusing correlation with causation in your breakdowns: because a setup performed better in a given month doesn't mean it's structurally superior, it may simply reflect that period's market conditions.
The third, subtler trap is confirmation bias: searching your numbers for what confirms what you already believe about your strategy, while downplaying what contradicts it. A trader convinced their favorite setup is excellent will tend to skim over statistics showing the opposite. The counter is to set, before looking at your numbers, the precise questions you want answered, rather than searching afterward for a story that reassures you.
Analyzing execution, not just the result
An often-overlooked dimension of performance analysis is the gap between your plan and your actual execution. Two trades can have exactly the same result in R and yet reveal opposite realities: one was taken exactly to your rule, the other was taken outside the setup but won by luck. If you only analyze results, these two trades look alike; if you analyze execution, they tell completely different stories.
That's why a complete analysis always crosses financial performance with plan fidelity: what proportion of your trades actually respected your entry criteria, your planned stop placement, your exit rule. A trader can have a positive P&L for a month while having very low plan fidelity, meaning their success owes more to luck than to their system, a fragile situation that almost always ends up reversing. Spotting this gap early, before it turns into a loss, is one of the most valuable contributions of rigorous analysis.
Documenting qualitative context, not just numbers
Numeric indicators tell part of the story, but not the whole story. Two trades identical on paper (same setup, same result in R) can have been experienced very differently: one taken calmly according to plan, the other taken under tension after a short night's sleep or a personal argument. These qualitative elements show up in no classic numeric indicator, yet they often explain why a trader executes well one day and poorly the next, with a strictly identical strategy.
Noting this qualitative context next to each trade, even briefly, considerably enriches your analysis when you revisit it later. You can then cross your under-performance moments not only with objective variables (time, instrument, setup) but also with your general life state at the time of the trade. This extra layer of analysis, more qualitative than quantitative, usefully complements numeric indicators without ever replacing them, and often reveals patterns invisible in the statistics alone.
How Tradoshi analyzes your performance
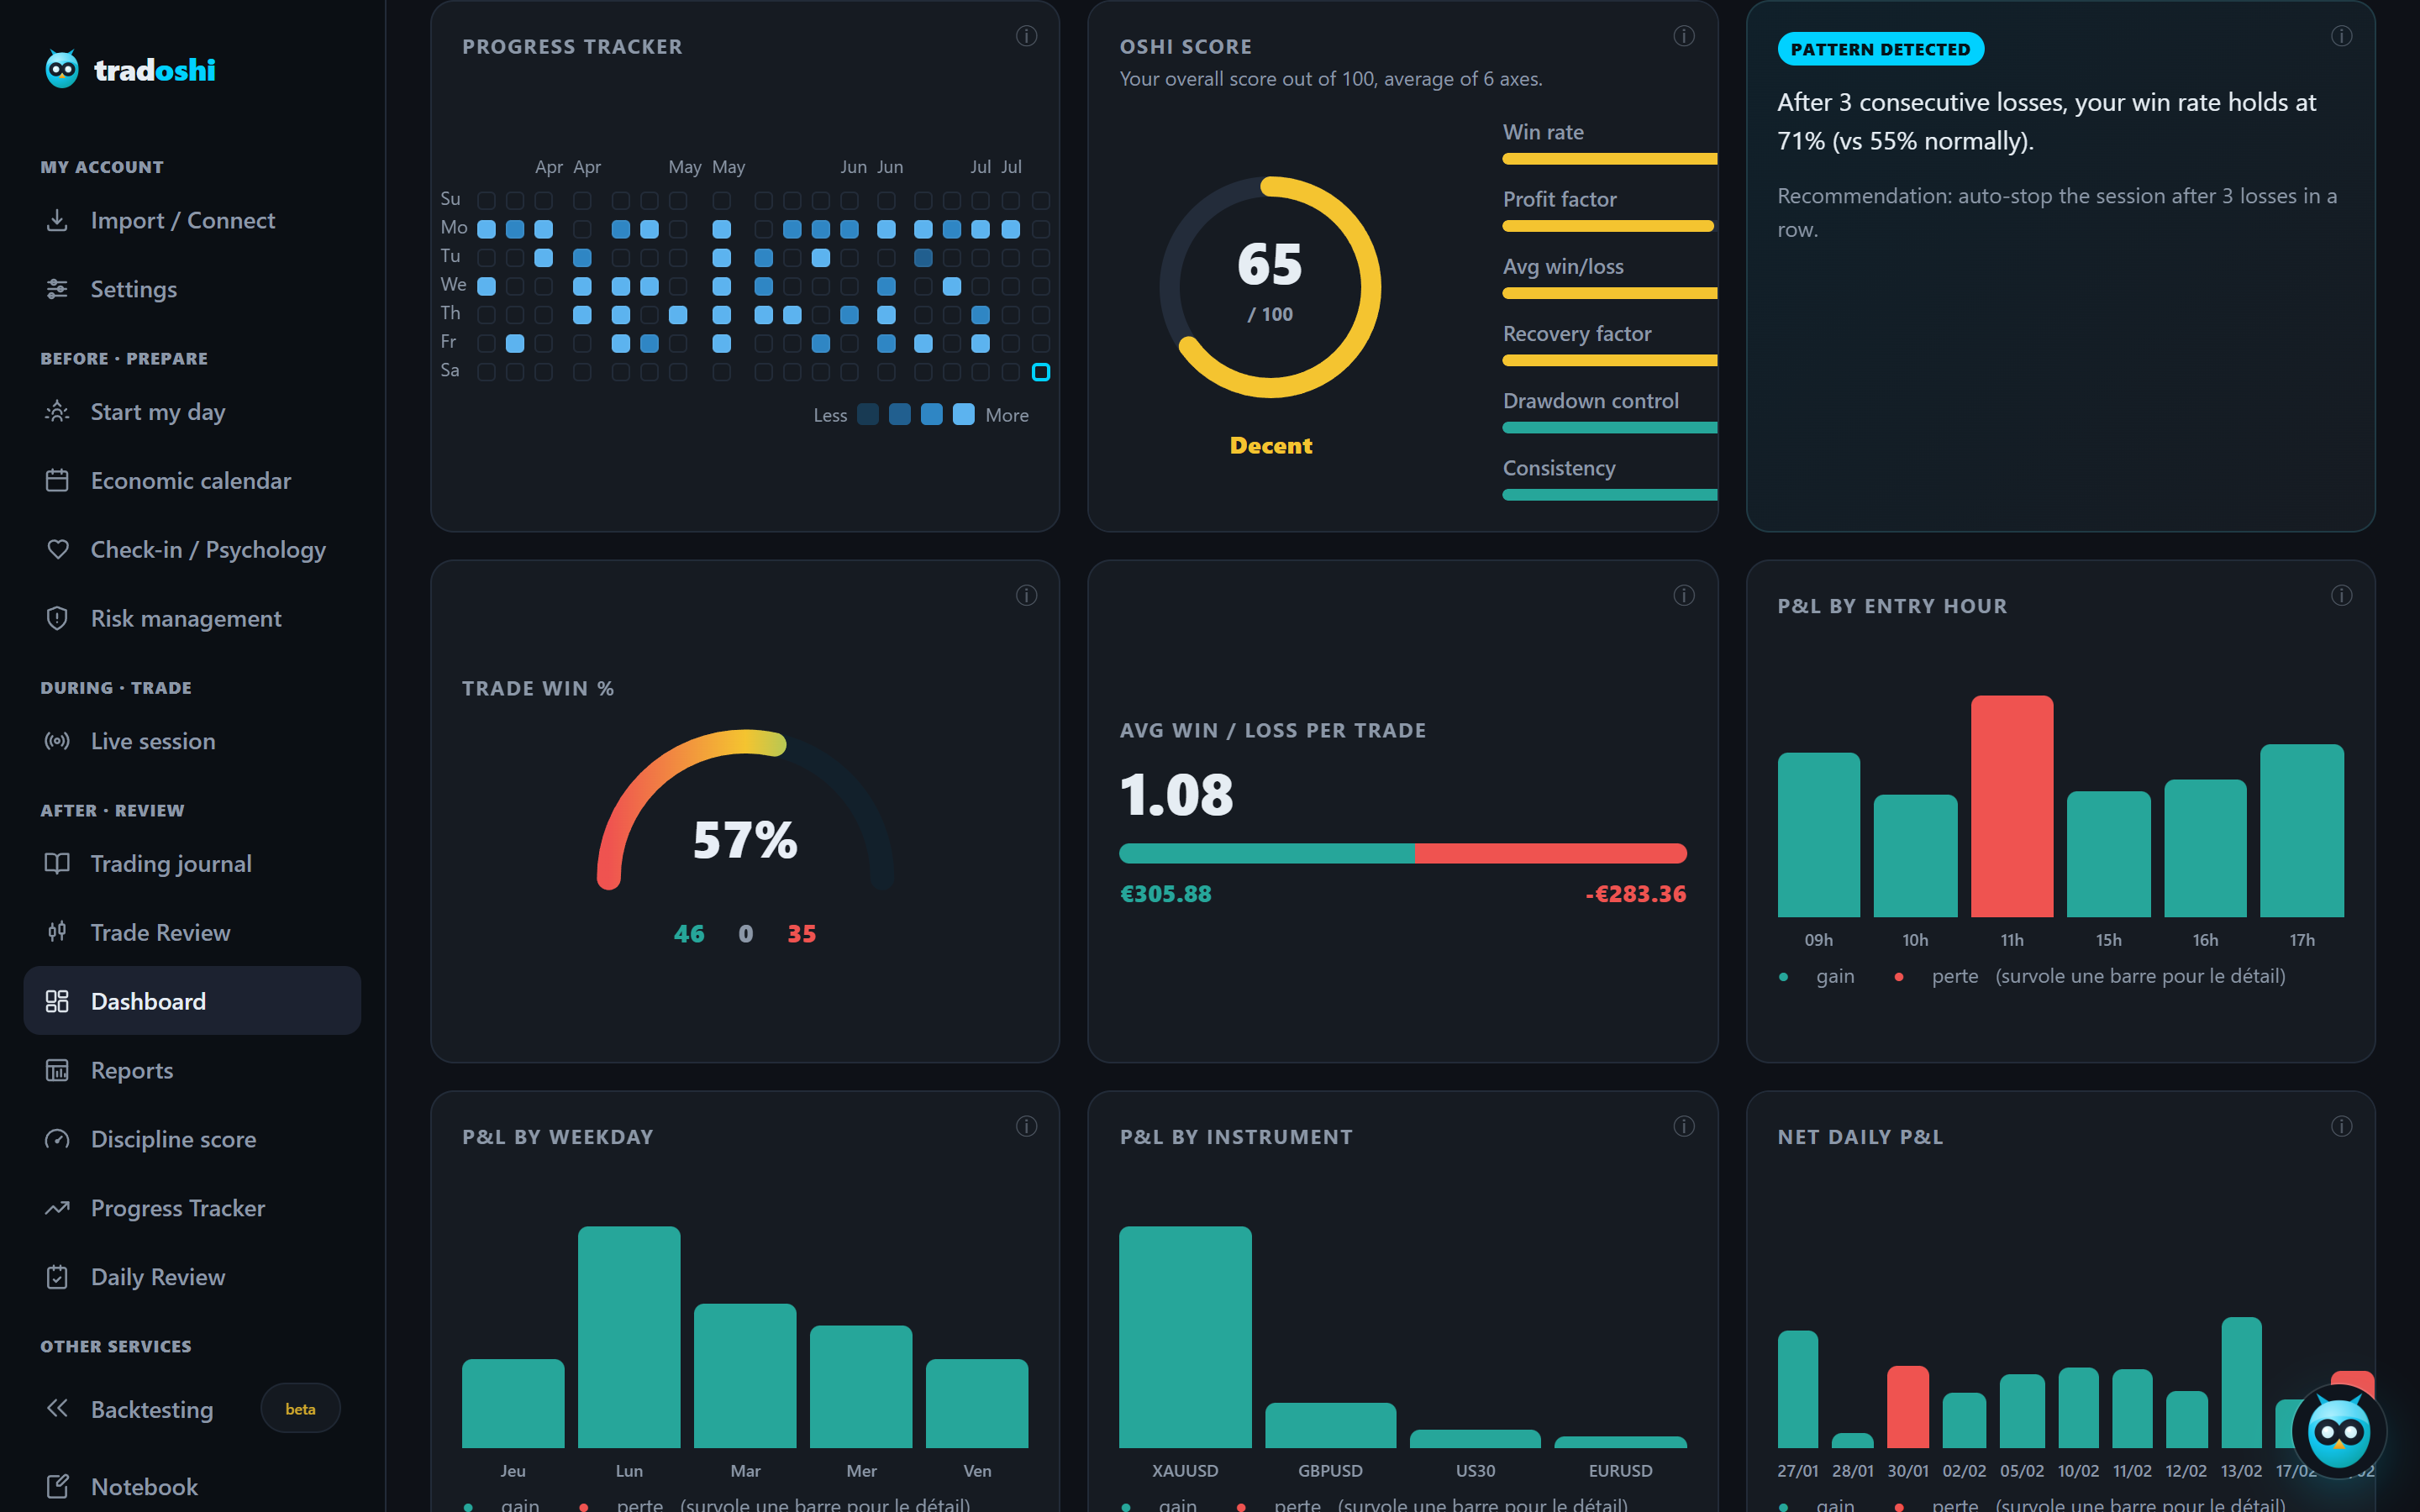
Tradoshi automatically computes all your indicators and breakdowns on your real trades, without any spreadsheet. You get a complete, up-to-date analysis on every sync, ready to lead to action.
- Key indicators (win rate, profit factor, expectancy, drawdown, average R) computed automatically.
- Breakdowns by hour, day, instrument and setup to understand where your results come from.
- Oshi Score that summarizes your performance across several axes into an overall rating.
- Tracking over time to see whether your edge strengthens and your corrections work.
Frequently asked questions
How do I analyze my trading performance?
By going beyond the P&L to understand where your results come from. Look at a few key indicators (win rate, profit factor, expectancy, drawdown, average R) read together, then break down your performance by time, instrument, setup and emotion to reveal the why. Always conclude with one or two concrete actions.
Why isn't P&L enough?
Because the P&L is an overall result that hides everything that matters: it doesn't tell you whether you win from your edge or by luck, whether your performance is steady or carried by a few shots, or where your leaks are. Analyzing means opening the hood and breaking down this result into its causes, to understand not just how much but why.
Which indicators should I watch to analyze my trading?
A handful suffice: the win rate (win frequency), the profit factor (profitability), the expectancy (average gain per trade), the maximum drawdown (worst drop) and the average R (performance in units of risk). They're read together, never in isolation: it's their combination that gives the true portrait of your trading.
Why look at consistency and not just the average?
Because two traders with the same P&L can have opposite profiles: one wins small amounts steadily (solid trading), the other depends on rare big gains masking losses (fragile trading). Analyzing the distribution of your results tells you where your performance really comes from and how robust or luck-dependent it is.
How often should I analyze my performance?
Regularly, ideally in a routine like a weekly review. A one-off analysis gives a snapshot, but tracking over time reveals trends: is your edge strengthening, are your corrections working, is a problem appearing? Regularity separates the trader who steers their progress from the one who suffers their results.
Why doesn't a high win rate guarantee profitability?
Because profitability depends on expectancy, which crosses win rate with the average-gain-to-average-loss ratio. A trader with a 70% win rate but small average gains and bigger average losses can have negative expectancy, while a trader who loses 60% of the time but with a favorable gain/loss ratio can be solidly profitable.
How do I avoid confirmation bias when analyzing my trades?
By setting, before looking at your numbers, the precise questions you want answered, rather than searching afterward for a story that confirms what you already believe about your strategy. A trader convinced their favorite setup is excellent will otherwise tend to skim over statistics showing the opposite.