You want to keep a trading journal for free, in Excel or Google Sheets. Good call: a journal, even a basic one, beats no journal a thousand times over. Here's exactly which columns to track, the formulas to compute your real stats, and how to build it all step by step, for free, without mistakes.
- The bare minimum: date, instrument, direction, entry, exit, stop, size, net P&L, emotion. Without these, a journal is useless.
- The formulas that matter: win rate, R-multiple, profit factor, expectancy. We give them to you, ready to paste.
- Excel has limits: manual entry, errors, no sync, no psychology tracking. We tell you where it breaks and how to go further.
Keeping a trading journal is the only way to turn your experience into progress: without it, you repeat the same mistakes without seeing them. And to start, a free spreadsheet does the job perfectly. The trap is tracking the wrong columns (or too few), and never computing the stats that actually matter.
This article gives you a complete template: the exact columns to include, the Excel/Google Sheets formulas ready to paste for your statistics, the Excel vs Google Sheets vs Notion comparison, and the limits of a manual journal, so you know when a dedicated tool becomes more worthwhile than the spreadsheet.
You can also get this simple Excel trading journal template for free by email, as an example, to start right away with the right columns and the formulas already in place: click the button below, enter your address and it lands in your inbox as an attachment.
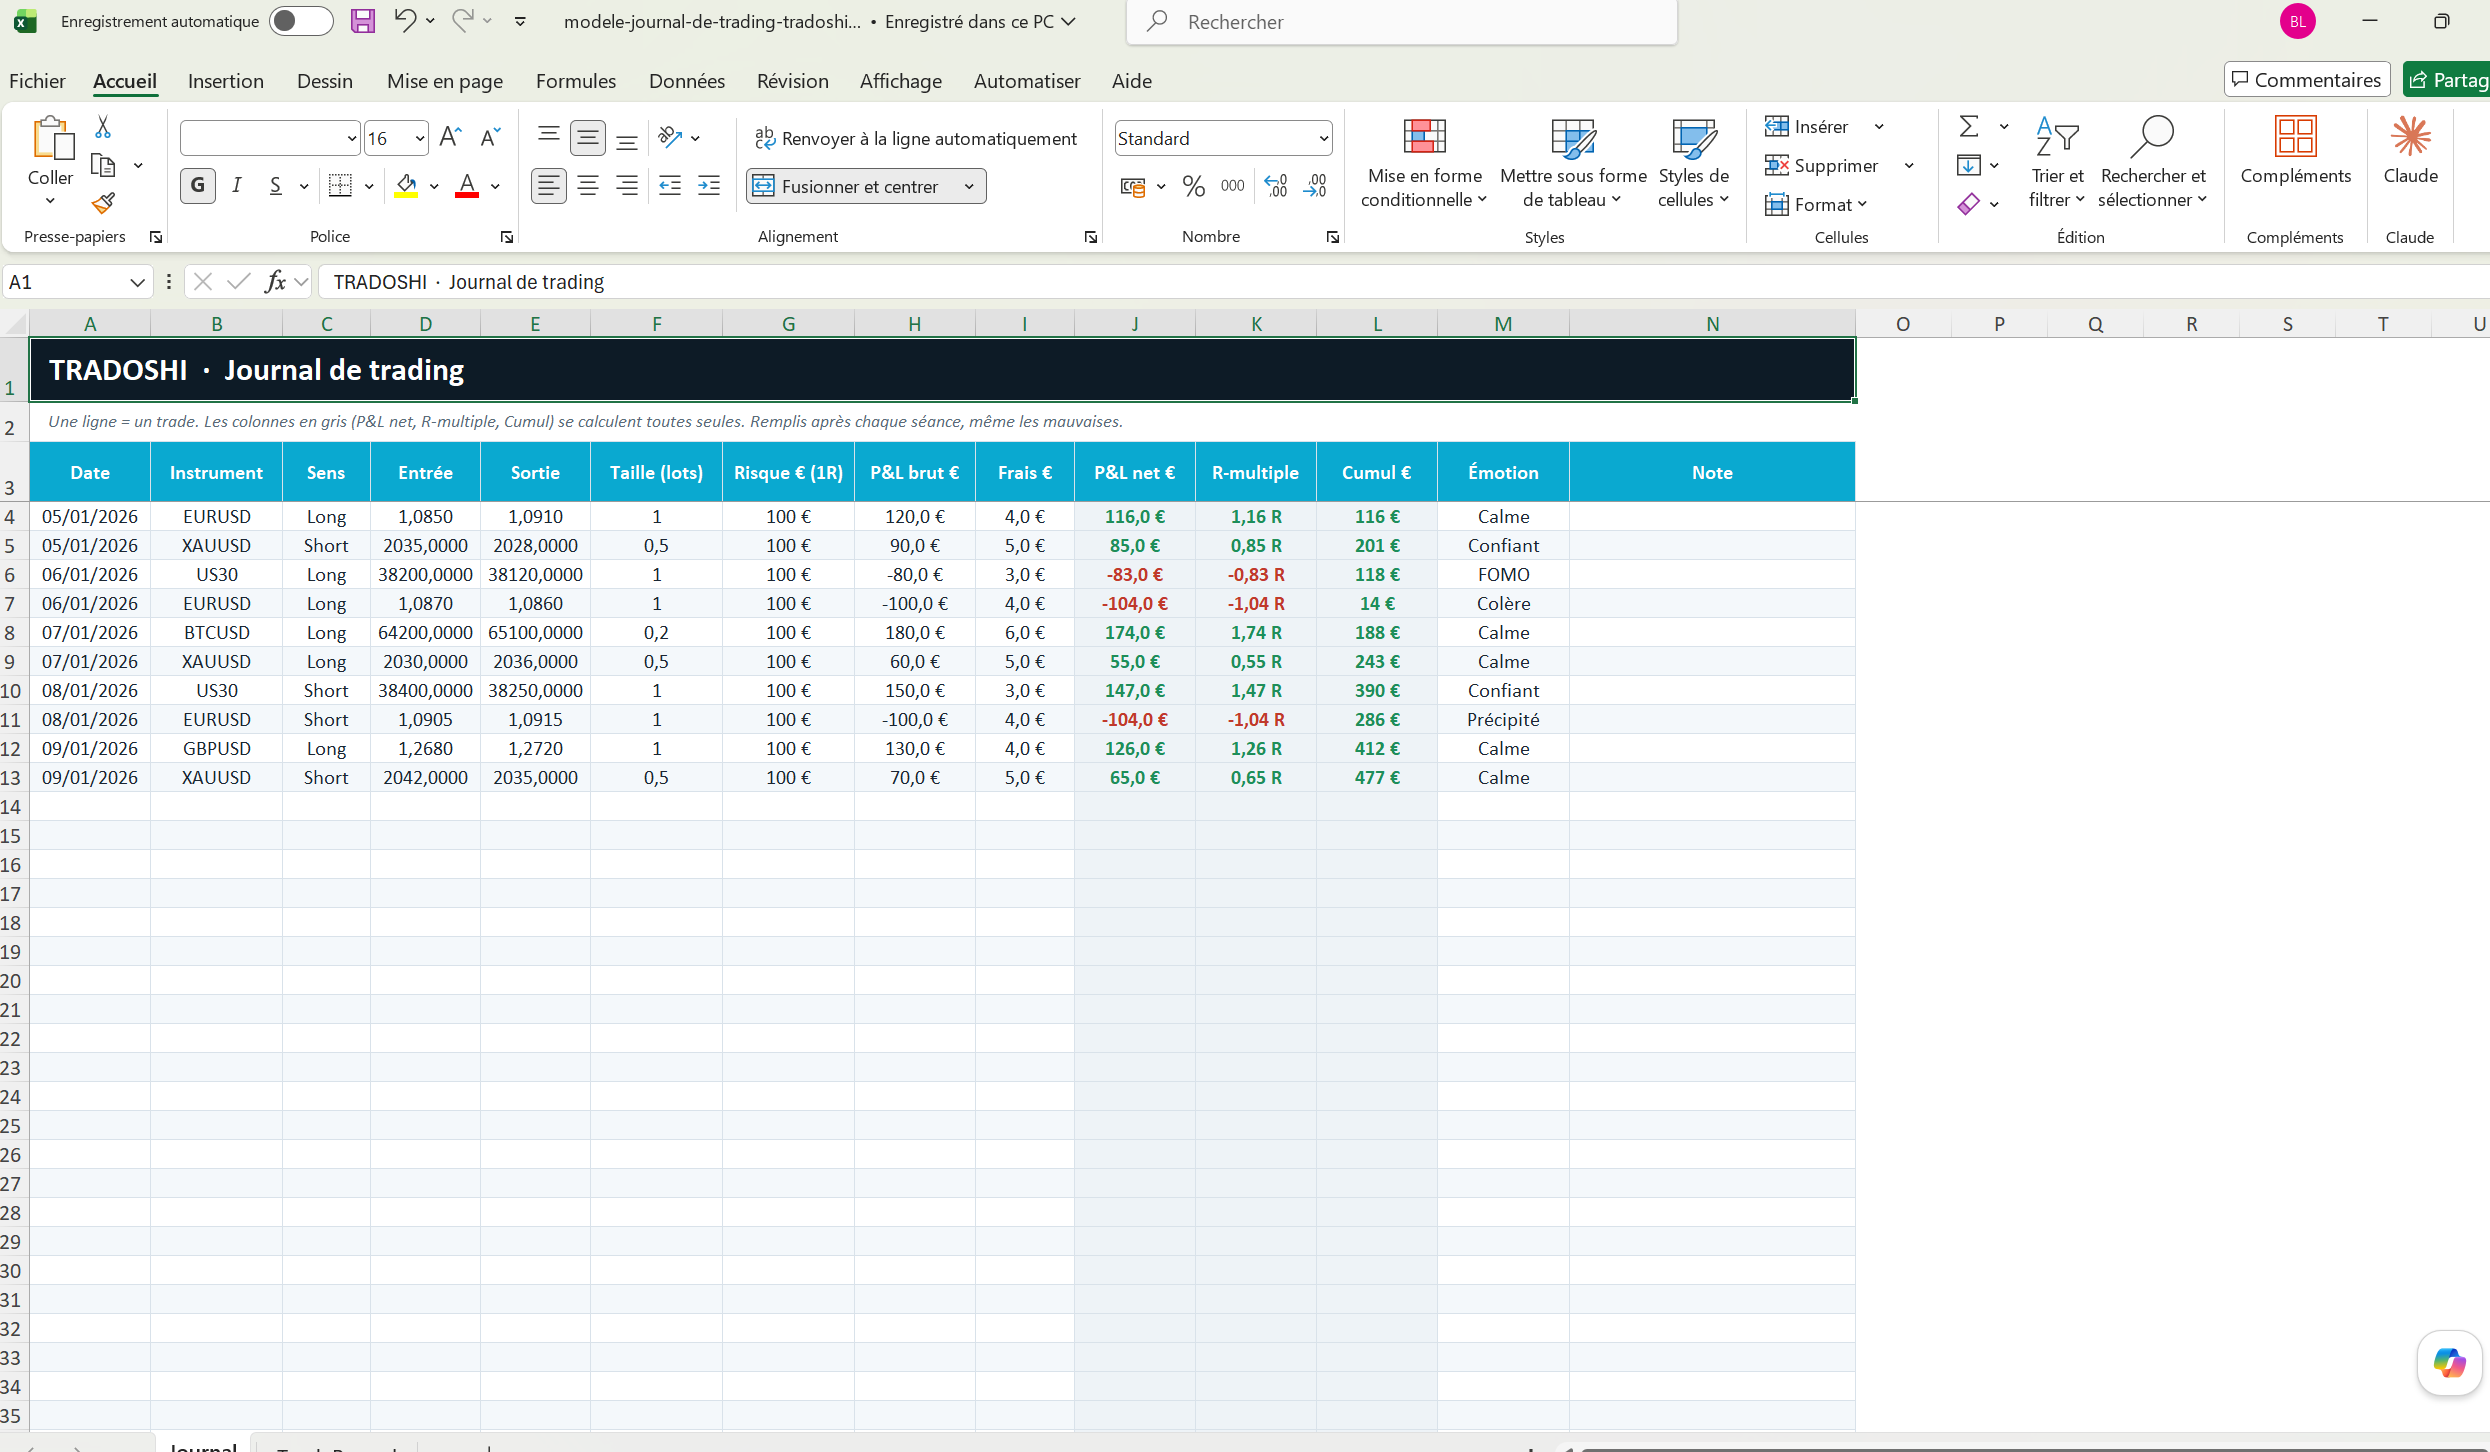
What a trading journal must contain
A useful journal isn't a list of gains and losses, it's a record rich enough to surface patterns. Here are the bare-minimum columns, the ones without which your stats mean nothing:
| Column | What it's for |
|---|---|
| Date / time | Spot time-of-day and fatigue effects |
| Instrument | See which assets earn or cost you |
| Direction (long/short) | Detect a directional bias |
| Entry / Exit | Compute the real result |
| Stop loss | Compute risk and R-multiple |
| Size (lots) | Check your risk consistency |
| Gross P&L / Fees / Net P&L | The real result, fees included |
| R-multiple | Judge quality, not just the amount |
| Emotion | Tie your state to your performance |
| Note | The context numbers don't capture |
The most neglected column, and the most valuable, is emotion. Crossed with the result, it reveals that your worst days follow a specific state. A spreadsheet won't fill it for you: it's on you to log it after each session.
Building your journal in Excel, step by step
1. Create the trades tab
On the first row, put the headers above (one column each). Each following row = one trade. Format the Date column as a date, the price and P&L columns as numbers with 2 decimals. Freeze the top row (View → Freeze top row) to keep the headers visible.
2. Compute net P&L
Net P&L is gross minus fees (commission + swap). Never work off gross alone: fees often turn a winning system into a losing one. Add a Net P&L = Gross P&L − Fees column, and compute everything else from it.
3. Compute the R-multiple
1 R is your initial risk (distance between entry and stop). The R-multiple brings all your trades to the same scale, whatever the size. A trade that wins twice your risk is +2 R; a stopped-out trade is −1 R. It's far more telling than the amount in currency, because it measures decision quality.
The formulas to paste (Excel and Google Sheets)
Assuming your net P&L values are in column K (K2 to K100), here are the formulas for your real statistics:
| Statistic | Formula (adapt to your columns) |
|---|---|
| Total net P&L | =SUM(K2:K100) |
| Number of trades | =COUNT(K2:K100) |
| Win rate | =COUNTIF(K2:K100,">0")/COUNT(K2:K100) |
| Average gain | =AVERAGEIF(K2:K100,">0") |
| Average loss | =AVERAGEIF(K2:K100,"<0") |
| Profit factor | =SUMIF(K2:K100,">0")/ABS(SUMIF(K2:K100,"<0")) |
| Expectancy | =AVERAGE(K2:K100) |
These four metrics (win rate, profit factor, expectancy, average R) are enough to know whether your system wins. Never rely on win rate alone: a high win rate with big losses can ruin you, a low one with a good ratio can make you profitable.
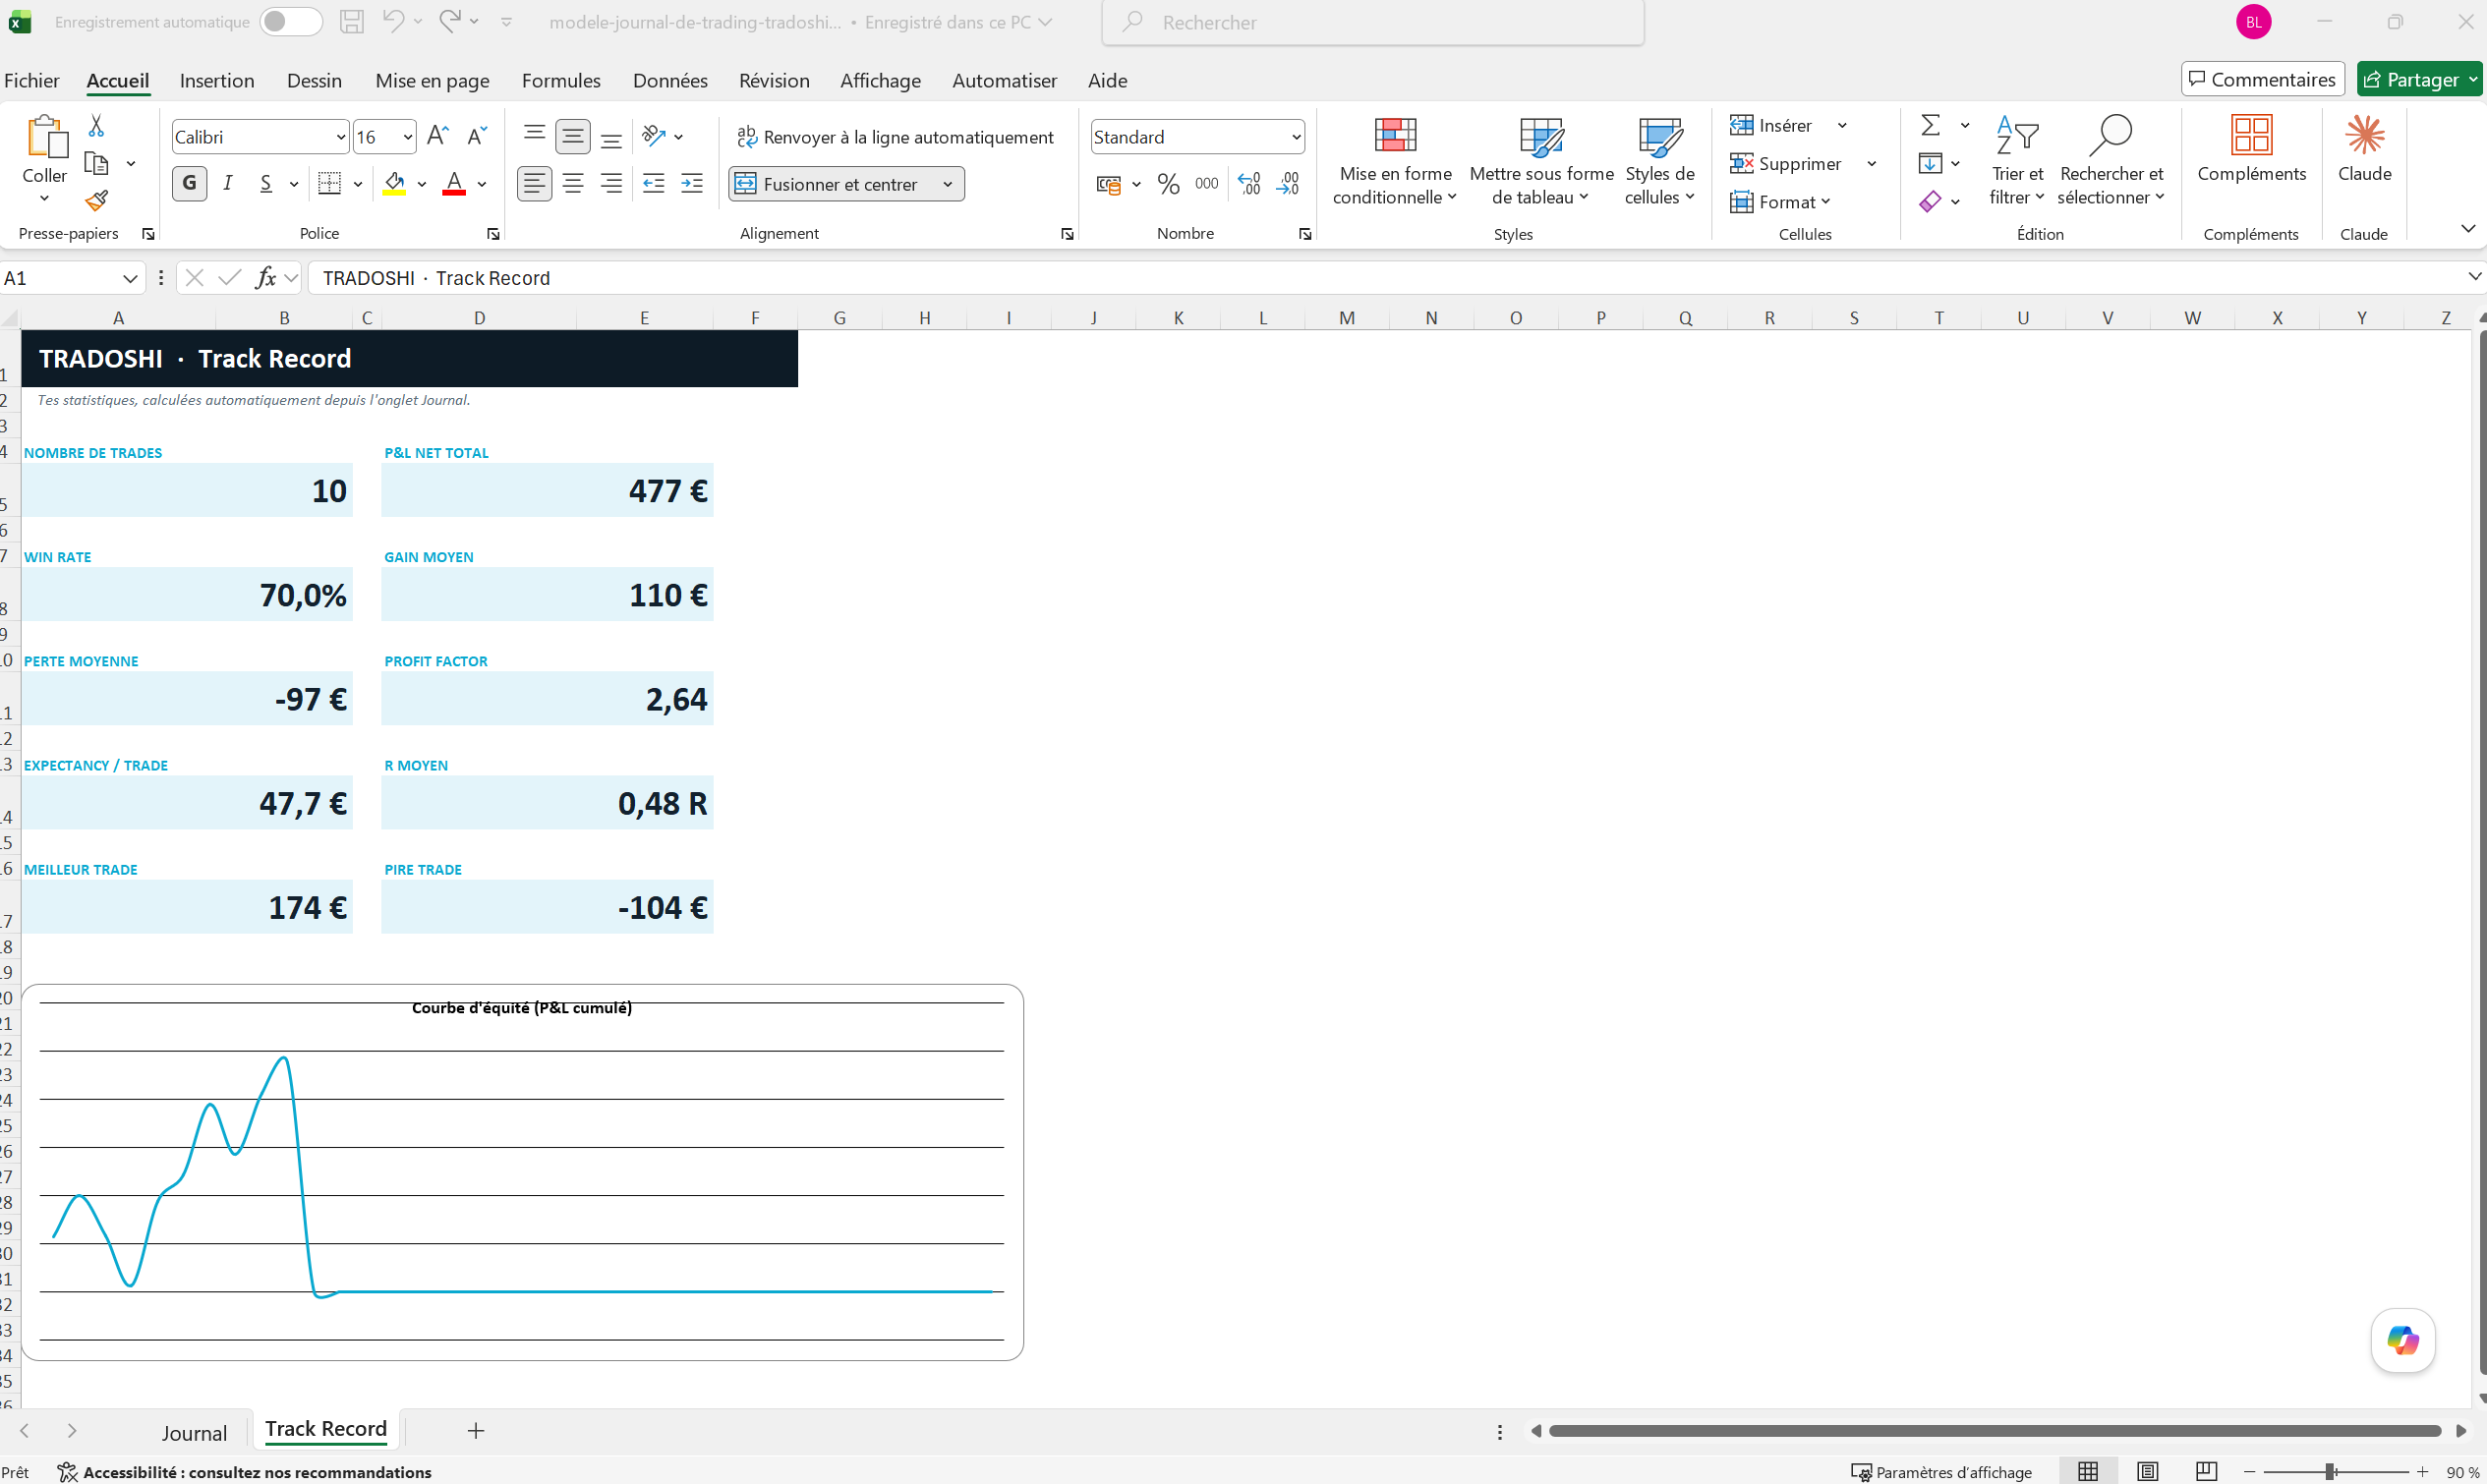
Excel vs Google Sheets vs Notion
All three work for a free journal; the best depends on your use.
| Tool | Strength | Limit |
|---|---|---|
| Excel | Powerful formulas, offline | Harder to share, local |
| Google Sheets | Accessible anywhere, sharing, free | Slightly slower on large volumes |
| Notion | Beautiful, rich per-trade notes | Weak formulas/stats, limited calc |
For real statistics, Excel or Google Sheets beat Notion (whose calculations are limited). Notion shines for qualitative notes, less for the numbers.
The limits of an Excel journal
A spreadsheet is perfect to start, but it quickly shows its limits when you want to progress seriously:
- Manual entry: logging every trade by hand is tedious, and you end up quitting, especially after a bad day, exactly when the journal would be most useful.
- Errors: one mis-copied formula, one shifted cell, and your stats become wrong without you noticing.
- No broker sync: no connection to your account, so no cent-accurate computation (fees, swaps, partial fills).
- No structured emotional tracking: you can note an emotion, but not automatically cross it with your performance.
- No measured discipline: no score telling you whether you respected your rules.
The alternative: a journal that almost keeps itself
The day manual entry makes you abandon your spreadsheet, an automatic journal takes over. That's what Tradoshi does: it syncs your trades from your broker (cent-accurate, fees and R-multiple included), computes every stat in this article without a single formula, and adds what Excel can't: an emotional check-in crossed with your performance and a discipline score on your real rules.
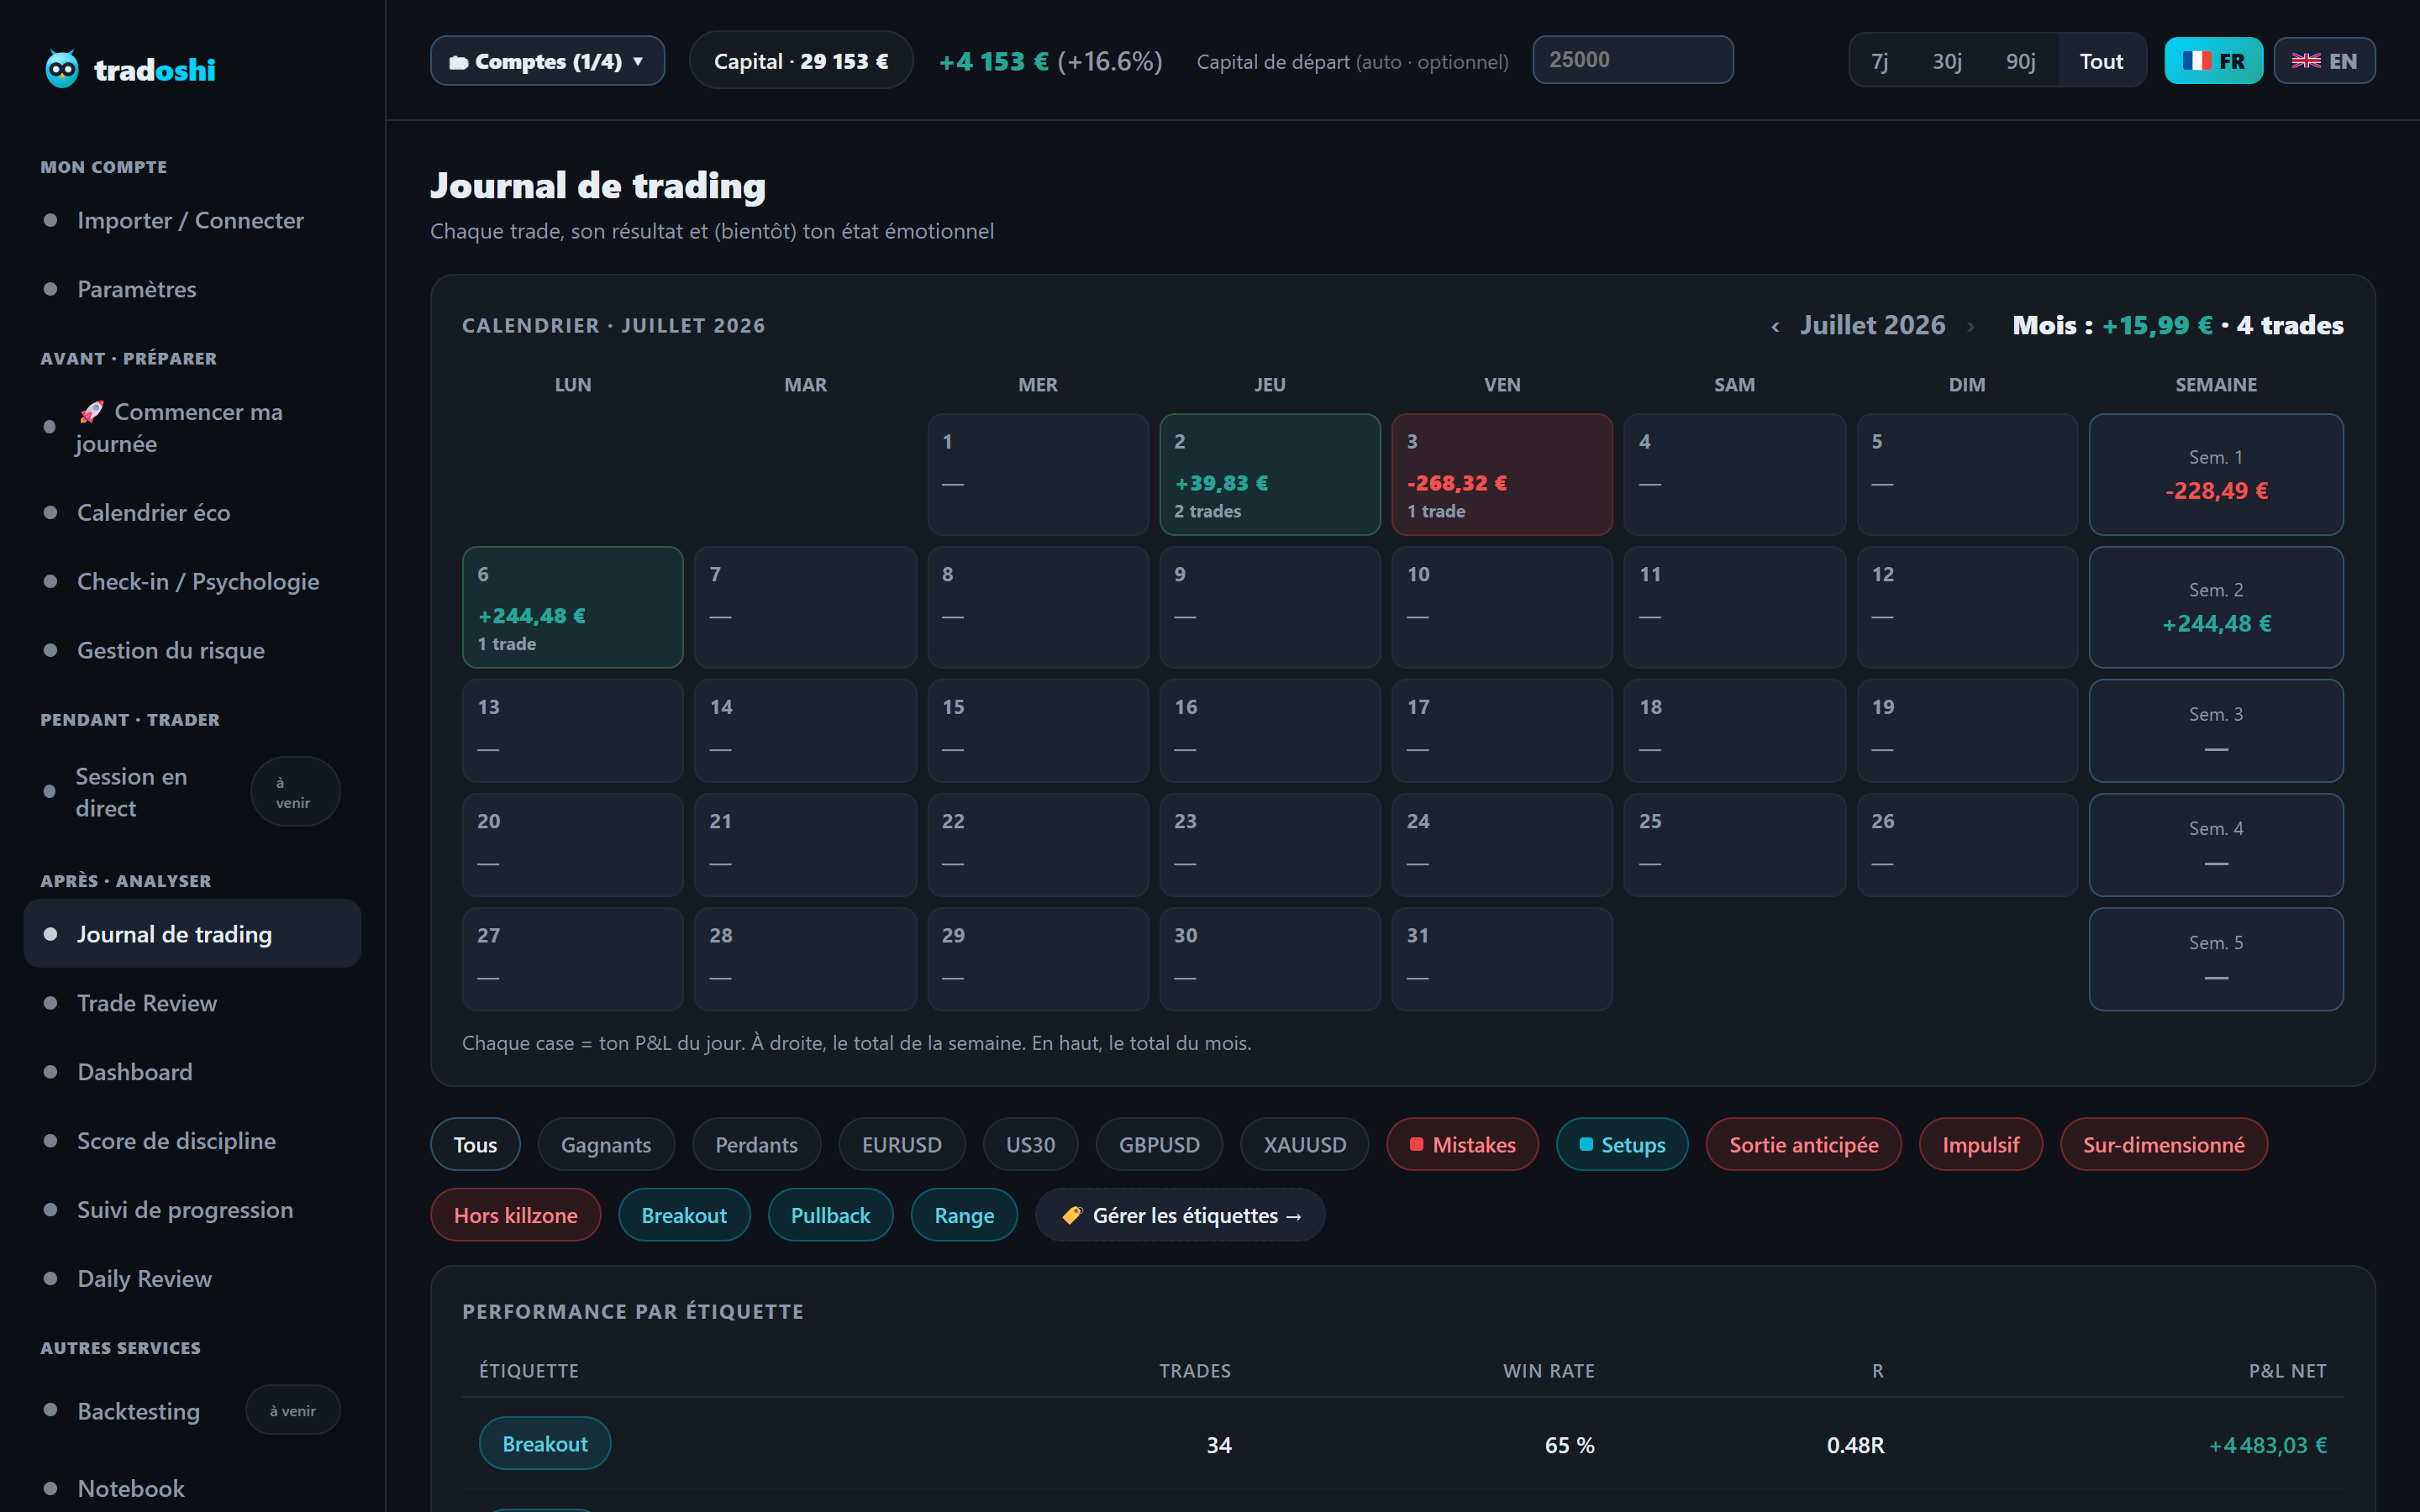
The point isn't that the spreadsheet is bad, it's that it makes you carry the tedious work (entry, formulas, checks) instead of leaving you the analysis. Start in Excel if you want, and switch when you're tired of re-typing your trades by hand.
A worked example
Take ten trades logged in your spreadsheet, with their net P&L. Here's how to read your stats from a small sample, to understand exactly what the formulas compute.
| Metric | Example (10 trades) | Reading |
|---|---|---|
| Winning trades | 6 of 10 | Win rate 60% |
| Average gain | +120 | On the 6 winners |
| Average loss | −90 | On the 4 losers |
| Total net P&L | +360 | 6×120 − 4×90 |
| Profit factor | 2.0 | 720 gains / 360 losses |
| Expectancy | +36 / trade | What an average trade earns |
This small example shows the key point: a 60% win rate isn't enough to conclude, it's the profit factor (2.0) and expectancy (+36 per trade) that say the system wins. Careful: over just ten trades, luck weighs heavily. These numbers only become reliable over dozens, ideally hundreds of trades. That's also where a spreadsheet shows its limits: recomputing and checking all this by hand, trade after trade, quickly becomes discouraging.
Common Excel journal mistakes
Most Excel journals fail for the same reasons. Avoid these five traps and your spreadsheet will genuinely serve you:
- Computing on gross P&L: forgetting fees distorts everything; a system 'winning' gross can be losing net.
- Only filling good days: a journal biased toward gains is useless. Log the bad days too, especially.
- Too many columns: twenty columns you never fill are worth less than ten kept on every trade.
- Forgetting emotion: without it, you'll never see the link between your state and your losses.
- Never reviewing: a journal you fill but don't analyze is wasted work. Block a review slot every week.
How to start now
- Create your tab with the bare-minimum columns (above).
- Paste the win rate, profit factor and expectancy formulas.
- Fill it after EVERY session, including the bad ones: consistency is everything.
- After a few weeks, look at the patterns: which instruments, which hours, which emotions cost you.
- When entry becomes a chore, switch to an automatic journal to keep the analysis without the grind.
Frequently asked questions
How do I make a trading journal for free?
In Excel or Google Sheets. Create one row per trade with columns for date, instrument, direction, entry, exit, stop, size, net P&L, emotion, then add a few formulas (win rate, profit factor, expectancy) to get your stats. It's 100% free and enough to start.
What columns should a trading journal Excel have?
The bare minimum: date/time, instrument, direction (long/short), entry price, exit price, stop loss, size, gross P&L, fees, net P&L, R-multiple, emotion and a note. Net P&L and emotion are the most often forgotten columns, and the most useful.
How do I compute my win rate in Excel?
With the formula =COUNTIF(pnl_range,">0")/COUNT(pnl_range). It divides the number of winning trades by the total number of trades. But never judge your trading on win rate alone: always read it alongside your win/loss ratio.
Excel or Google Sheets for a trading journal?
Both work. Google Sheets is handier if you want to access it anywhere and share it (with a mentor, for example); Excel is a bit more powerful on large volumes and works offline. Notion looks nice but is weak on calculations.
Is an Excel journal enough, or do I need an app?
Excel is enough to start and learn the basics. Its limits come fast: tedious manual entry (which people end up abandoning), formula errors, no broker sync, no automatic emotional tracking. A dedicated app becomes worthwhile as soon as entry makes you drop the journal.
How do I compute a trade's R-multiple?
1 R is your distance between entry and stop (your initial risk). The R-multiple = the trade's gain (or loss) divided by that initial risk. A gain of twice the risk = +2 R, a stopped-out trade = −1 R. It's what lets you compare trades of different sizes on the same scale.
How often should I fill my trading journal?
After every trading session, while it's fresh, including (especially) the bad days. Consistency matters more than perfection: a short journal kept every day beats a perfect one filled once a month.