Order flow is the idea of reading the actual flow of buy and sell orders trading on an instrument, rather than settling for the shape of candlesticks on a chart. For its followers, it's a window into what's really happening beneath the price: who's aggressing, who's absorbing, where the imbalance is building. It's also a demanding discipline, costly in data and attention, that doesn't replace a trading plan, at best it complements one.
- Order flow reads the real order flow (aggressive buys/sells, volume at price), not just the shape of price.
- Typical tools are the footprint chart, the order book (DOM) and time and sales.
- It's heavily used in futures and index trading, markets where flow data is rich and centralized.
- Its limits are real: data cost, interpretation complexity, and no guaranteed edge just from 'seeing' the flow.
A candlestick chart shows you the result of a battle between buyers and sellers: an open, a high, a low, a close. What it doesn't show directly is how that battle unfolded inside the candle, or the size and aggressiveness of the orders that produced it. Order flow tries precisely to fill that gap, giving access to a finer reading of the real activity happening on the order book.
This guide explains what order flow actually is, the conceptual tools used to read it, why this approach is especially popular in futures and index trading, and above all, its real limits for a retail trader considering picking it up.
What reading order flow means
Concretely, order flow refers to analyzing the detail of the transactions that make up the price: how much volume traded at each specific price level, whether that volume came mostly from aggressive buy orders (hitting the offer) or aggressive sell orders (hitting the bid), and how that ratio evolves in real time. It's a far more granular reading than a classic candlestick chart, which only shows the net result of that activity over a given period.
The idea behind this approach is that the shape of a candle can hide very different activity from what it suggests at first glance. A candle that closes slightly higher may, in reality, have seen massive selling pressure absorbed by equally massive buying, information invisible on a classic chart but potentially significant for anticipating what comes next. It's this information 'hidden behind the candle' that order flow tries to reveal.
The typical reading tools
The footprint chart is arguably the most iconic order flow tool. It displays, inside each candle, the detail of the volume traded at each price level, often split between buy and sell volume. Instead of a simple wick and body, you see a grid of numbers revealing where activity concentrated within the period itself.
The order book, or DOM (depth of market), shows in real time the resting orders above and below the current price, giving a sense of available liquidity at each level. Time and sales (also called the 'tape') lists every executed transaction, chronologically, with its price, volume and sometimes its aggressiveness. Together, these three tools form the classic order flow reading toolkit, each bringing a different angle on the same underlying activity.
| Tool | What it shows |
|---|---|
| Footprint chart | Detailed buy/sell volume, inside each candle |
| Order book (DOM) | Resting liquidity, above and below the price |
| Time and sales (tape) | Every executed transaction, in real time, chronologically |
| Delta | The net balance between aggressive buy volume and aggressive sell volume |
Why it's popular in futures and index trading
Order flow developed and became mainstream mainly in futures and index markets, for a simple structural reason: these markets are centralized on a single exchange, which makes displayed volume reliable and representative of real activity. In a market fragmented across multiple venues, as spot foreign exchange can be, the volume shown by a single broker only represents a fraction of global activity, which makes order flow reading far less reliable.
Traders who operate in index futures or commodity futures contracts have therefore historically had access to better quality flow data, which explains the popularity of these tools in that specific segment of trading. It's not that order flow is unusable elsewhere, it's that its reliability depends directly on the quality and centralization of the data available for the instrument in question.
An illustrative reading example
Imagine a futures contract approaching a resistance level identified on the chart. On a footprint chart, you might observe a buildup of aggressive sell volume just below that level, with a delta turning increasingly negative candle after candle, even as the price itself hasn't broken down yet. For an order flow reader, this kind of illustrative setup could be read as a sign of absorption: sellers pushing hard without managing to break the level, which could precede either a violent breakdown if sellers eventually win out, or a reversal if buyers take over.
This example is purely illustrative of the reading logic, not a reliable prediction: two experienced order flow readers could interpret the same sequence differently depending on the broader market context, and nothing guarantees a similar pattern repeats in an exploitable way. Order flow gives extra information to interpret, not an automatic signal to follow blindly.
The real limits for a retail trader
The first limit, often underestimated, is cost. Access to quality flow data, especially the full order book and real-time footprint, typically requires a subscription to a specialized platform and a paid data feed, on top of regular brokerage. For a beginning trader or one managing a small account, that recurring cost can be a significant burden before an edge has even been proven.
The second limit is interpretation complexity. A footprint chart loaded with numerical information takes a long time to train yourself to read in real time, under pressure, while the market is moving. Many traders who dive into order flow underestimate this learning curve and end up overwhelmed by the amount of information displayed, which degrades their decision-making instead of improving it.
The third limit, the most important to remember, is that there's no guaranteed edge just from 'seeing' the order flow. Seeing the activity doesn't mean knowing how to interpret it correctly, nor knowing when to act on that information. Order flow gives extra context, but it doesn't in any way replace a structured trading plan, with clearly defined entry, exit and risk management rules set in advance.
A complement, not a replacement
The most common mistake among traders drawn to order flow is believing it can replace a full trading method on its own. In reality, order flow works best as a confirmation or timing layer added to an existing method: it can help refine an entry at a level already identified by another approach (market structure, zones, moving averages), not generate a complete trading plan by itself.
A trader who has already identified an interesting level through their usual method can, if they master order flow reading, use it to observe the market's actual reaction at that level before triggering, rather than entering blindly on price simply approaching. It's this complementarity, not a substitution, that makes order flow genuinely useful within a structured trading practice.
Learning to read order flow
Becoming able to read a footprint chart or an order book in real time, with enough ease to draw a useful decision from it while the market is moving, takes a training period often underestimated by traders discovering the discipline. Many start by observing these tools after the fact, on past sessions, to get familiar with recurring patterns before attempting a live reading under the market's real pressure.
This passive learning phase, before any real-money decision, is generally recommended by experienced order flow traders, precisely because the costliest mistake is over-interpreting a reading that isn't yet mastered. A poorly read order flow can look like it gives a clear signal when it gives none at all, and the only way to build reliable judgment on this is repeated practice, away from the pressure of capital at risk.
How Tradoshi helps
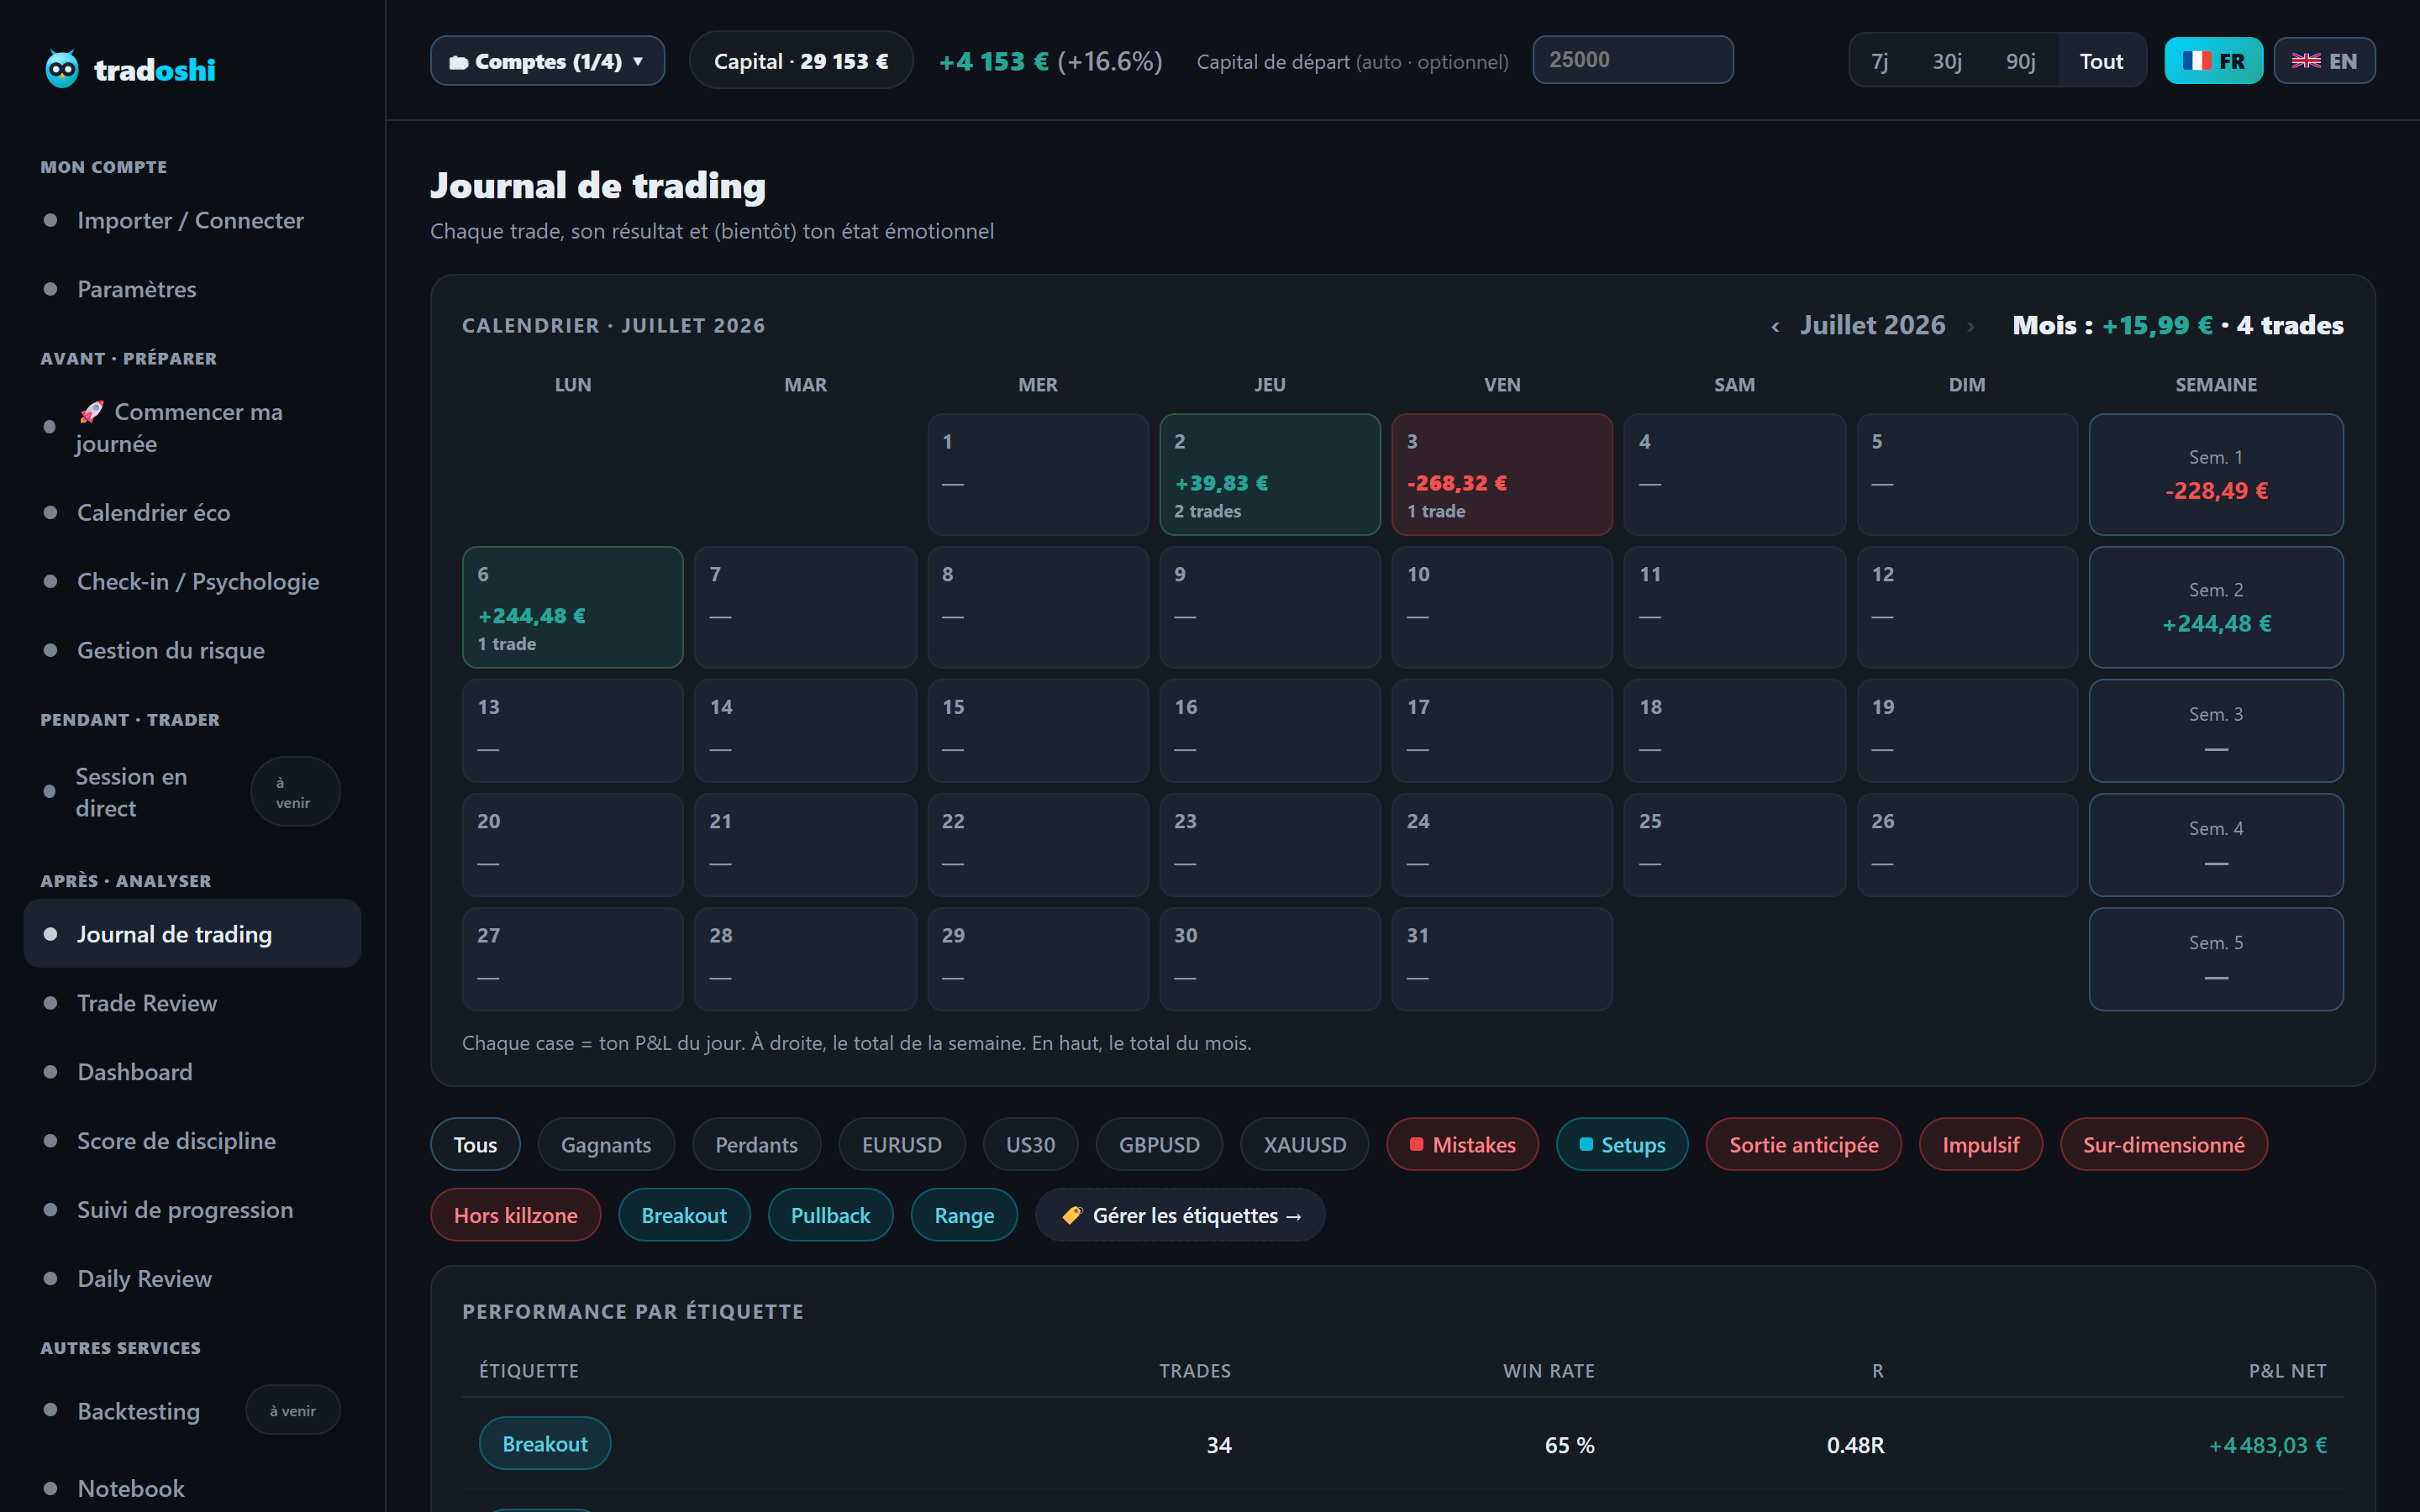
Whether your entry reading relies on order flow, on price zones, on indicators or on any other method, the question that matters stays the same: does it produce a measurable result over time? Tradoshi doesn't tell you how to read an order book, that's not its role, but it gives you the means to objectively check whether the way you use it actually improves your trades.
By tagging your trades taken with order flow confirmation against those taken without, you can compare their respective statistics over time and know whether that extra layer of analysis genuinely justifies the time and money you put into it.
- Per-trade setup tags: separate entries confirmed by order flow from entries without that confirmation.
- Compared stats by tag: win rate, average R-multiple and profit factor, side by side.
- Detailed journal: note your flow reading at the time of the trade to review yourself later, without hindsight bias.
- Market replay: revisit price history to verify after the fact how relevant your reading actually was.
Frequently asked questions
What is order flow in trading?
Order flow refers to analyzing the real flow of buy and sell orders: the volume traded at each price level, the share of aggressive buy or sell orders, and the resulting delta. It's a far more granular reading than the simple shape of candles on a classic chart.
What tools are used to read order flow?
The three main tools are the footprint chart (detailed volume inside each candle), the order book or DOM (resting liquidity above and below the price), and time and sales or the tape (every executed transaction in real time).
Why is order flow popular in futures and index trading?
Because those markets are centralized on a single exchange, making the displayed volume reliable and representative of real activity. In a market fragmented across multiple venues, like spot foreign exchange, the volume shown by a single broker only reflects a fraction of global activity.
What are the limits of order flow for a retail trader?
The cost of accessing quality data (a specialized subscription on top of brokerage), the interpretation complexity that takes a long time to learn, and the lack of any guaranteed edge just from seeing the flow: seeing the activity doesn't mean knowing how to interpret it correctly.
Can order flow replace a trading plan?
No. Order flow works best as a confirmation or timing layer added to an existing method, not as a complete trading plan on its own. A trader must still define entry, exit and risk management rules in advance.
Is order flow useful in spot foreign exchange (forex)?
It's less reliable than in futures, because the spot forex market is fragmented across multiple venues and the volume shown by a single broker only represents a fraction of real global activity. It isn't unusable, but interpretation calls for more caution.
How long does it take to learn to read order flow?
Generally longer than expected. Most experienced traders recommend a phase of after-the-fact observation, on past sessions, before any live reading attempt, since a poorly mastered reading can look like it gives a clear signal when it gives none at all.
Is delta reliable as a standalone signal?
No. Delta gives useful information about the balance between aggressive buying and selling pressure, but it should be read in context (price level, market structure, higher timeframe) rather than as an isolated signal sufficient on its own.