Backtesting is testing a strategy on past data to see whether it would have been a winner before risking your money. It's the step most traders skip, and one of the reasons they trade systems that have never proven they work. This guide explains what backtesting is, what it's really for, its limits, and how to use it without fooling yourself.
- Backtesting tests a strategy on the past before risking your capital.
- It gives you your system's reference statistics: win rate, profit factor, drawdown.
- It has limits: the past doesn't guarantee the future, and biases can distort your results.
- It's a filter, not a proof: it eliminates bad ideas more than it validates good ones.
Before committing real money to a strategy, a question arises: would it have won in the past? Backtesting answers this by applying your rules to historical data, to simulate what your trades would have given. It's a way to verify an idea holds up before confronting it with the market using real capital.
Backtesting is a powerful but often misunderstood and misused tool. Well done, it tells you whether your strategy has an edge and gives you valuable benchmarks; badly done, it gives you false confidence in a system that will never work live. This guide shows you what backtesting really is, what it can and can't do.
What backtesting does
Backtesting consists of applying your strategy's precise rules to past market data, as if you had traded during that period. For each signal your strategy would have generated, you simulate the trade, note its result, and thus accumulate a virtual performance history. At the end, you get the statistics your strategy would have produced over the tested period.
This process has immediate value, arguably the single most useful thing a trader can do before risking real money: it tells you whether your idea has a semblance of an edge before risking a cent. A strategy that clearly loses in backtest doesn't deserve your capital, and knowing it before trading spares you real losses. Backtesting is therefore first a bad-idea filter, a way to quickly eliminate what doesn't work without paying to learn it live.
The benchmarks it gives you
Beyond the simple winner-or-loser verdict, backtesting provides your strategy's reference statistics: its expected win rate, its profit factor, its expectancy, and above all its typical losing streak and maximum drawdown. These benchmarks are valuable, because they tell you what your system's normal behavior looks like.
Knowing these benchmarks has a major practical consequence: it lets you get through bad runs without panicking. When you know your strategy normally strings together up to seven losses in a row, for example, a streak of five losses doesn't make you doubt or quit. Without these benchmarks, every drawdown looks like a catastrophe and pushes you to change system at the worst moment. Backtesting gives you the map of the terrain before you venture into it, and that map is what stands between a trader who reacts calmly to a rough patch and one who abandons a perfectly good strategy in a moment of doubt.
Its real limits
Backtesting has limits you must know to avoid mistakes. The first and most important: the past doesn't guarantee the future. A strategy that worked well on historical data can fail live if market conditions change. Backtesting measures what happened, not what will happen, and this distinction is crucial.
A good backtest doesn't prove your strategy will win tomorrow. It only proves it could have won yesterday, which is necessary but far from sufficient.
Other limits relate to simulation quality: fees, slippage, real execution prices are hard to reproduce faithfully, and a backtest too optimistic on these points gives better results than reality. You must therefore always include realistic costs and be wary of perfect backtests. Backtesting is a partial validation tool, not a guarantee, and taking it for absolute proof is a frequent, costly mistake.
The overfitting trap
The most insidious backtesting trap is overfitting, or excessive optimization. It consists of refining your strategy so much that it fits the past data perfectly, becoming useless for the future. By adjusting dozens of parameters until you get a magnificent backtest, you end up modeling the randomness of the tested period rather than a real edge.
An overfitted strategy is recognizable by its complexity and fragility: it has many very specific rules, and its results collapse as soon as you change the parameters or period a bit. The counter is simplicity and robustness: a strategy with few rules, that works decently across several periods and instruments, is far more reliable than one perfect on a single period. A too-beautiful backtest should trigger suspicion, not enthusiasm.
Backtest and forward test
Backtesting is never enough alone; it must be complemented by a forward test. The forward test consists of applying your strategy in real or simulated conditions, on data you didn't use to build it, often on small size at first. It's the real test of truth, because it verifies your edge holds on unknown data, not just on the data used to calibrate it.
Combining the two is the right approach: the backtest quickly eliminates bad ideas and gives benchmarks, the forward test confirms the strategy works outside the past used to build it. A strategy that passes both steps deserves your trust, one that only excels in backtest is suspect and should be treated as unproven, not as an edge you can size up with confidence. Never committing serious capital based on a backtest alone is an essential prudence rule.
How to run a backtest step by step
Running a serious backtest always follows the same logic, whatever strategy you're testing. The first step is to write down precise, unambiguous rules: the exact entry conditions, the stop placement, the exit rule, and the position size. A vague rule like 'enter when the market looks ready to move' can't be backtested, because it leaves too much room for interpretation, including your own from one day to the next.
Once the rules are set, choose a representative period and instrument, including different market phases if possible (trending, ranging, high volatility). Then apply your rules trade by trade, including realistic costs (spread, commission, slippage), and log each trade with the same rigor as live trading. The last step is compiling the results into usable statistics, so you judge the strategy on numbers, not a general impression.
The essential statistics to calculate
A backtest is only as valuable as the statistics you pull from it. Win rate tells you the proportion of winning trades, but alone it says nothing about profitability: a strategy with a 30% win rate can be very profitable if the wins are far bigger than the losses. Profit factor (total gains divided by total losses) is often more telling, and expectancy (the average expected gain per trade) tells you concretely what each trade earns on average.
| Statistic | What it measures |
|---|---|
| Win rate | Proportion of winning trades |
| Profit factor | Total gains divided by total losses |
| Expectancy | Average expected gain per trade |
| Maximum drawdown | Worst observed capital pullback |
| Losing streak | Typical number of consecutive losses |
These statistics should be read together, never in isolation. A high win rate with a profit factor close to 1 signals wins too small relative to losses; a severe maximum drawdown warns of the real psychological and financial risk of the strategy, even if expectancy is positive on paper. Get in the habit of looking at these five numbers together before judging a backtest.
A worked example of a backtest
To make this concrete, imagine a trader backtesting a breakout strategy over 300 trades spread across three years. They get a 38% win rate, an average win of 180 on winning trades and an average loss of 70 on losing trades. The profit factor works out like this: (114 winning trades x 180) divided by (186 losing trades x 70), roughly 20,520 in gains against 13,020 in losses, a profit factor of about 1.58. This strategy has a positive edge despite a win rate under 40%.
This same backtest also reveals a streak of nine consecutive losses at one point in the tested period, and a maximum drawdown of 18% of capital. These two numbers matter as much as the profit factor, because they tell the trader what to expect psychologically: if they can't sit through nine losses in a row without panicking or deviating from the plan, the strategy isn't viable for them, even if it's statistically profitable on paper.
The mistakes that distort a backtest
Beyond overfitting, other mistakes silently distort a backtest. Data mining, or excessive data dredging, means testing dozens of variants of a strategy on the same sample until you find one that works by chance. Statistically, if you test enough variations, you'll always eventually find one that looks excellent over that specific period, without that proving anything about its future value.
Survivorship bias is another classic mistake, especially with stocks: testing a strategy only on companies that still exist today ignores all those that went bankrupt or were delisted, which artificially inflates results. Finally, neglecting realistic position sizing, for example testing with a fixed size that would never have been sustainable with the starting capital, produces statistics that will never translate into real performance.
Which period and instrument to test on
The question of historical depth comes up often: should you test on six months, two years, ten years? The longer the period, the more different market regimes you cover (strong trend, range, crash, low volatility), which makes the result more robust. A strategy that only works on the last six months of a bull market may have only tested one regime, and nothing guarantees it will survive the next shift in context.
Also test on several comparable instruments, not just the one you plan to trade. If your strategy only works on one specific instrument and collapses on similar ones, that's a warning sign: it may have captured a quirk of that instrument rather than a real, generalizable edge. A robust strategy keeps broadly positive performance across several related markets, even if it's never identical from one instrument to another.
Connecting your backtest to your risk management
A backtest isn't only for judging whether a strategy is good, it also serves to calibrate your risk management. Knowing your strategy's maximum drawdown and typical losing streak lets you set a coherent risk per trade: if the backtest shows up to nine consecutive losses are possible, risking 1% per trade means a theoretical drawdown of roughly 9%, which stays manageable, while risking 3% per trade would push that same drawdown to roughly 27%, a level few traders can handle psychologically without deviating from their plan.
This use of the backtest, upstream of the position-sizing decision, is often overlooked even though it's one of the most useful. A backtest that only serves to validate an edge misses half its value: it should also tell you how much to risk per trade so the strategy stays livable over time, without ever exposing you to a loss that threatens your account or your mind.
How Tradoshi complements your backtesting
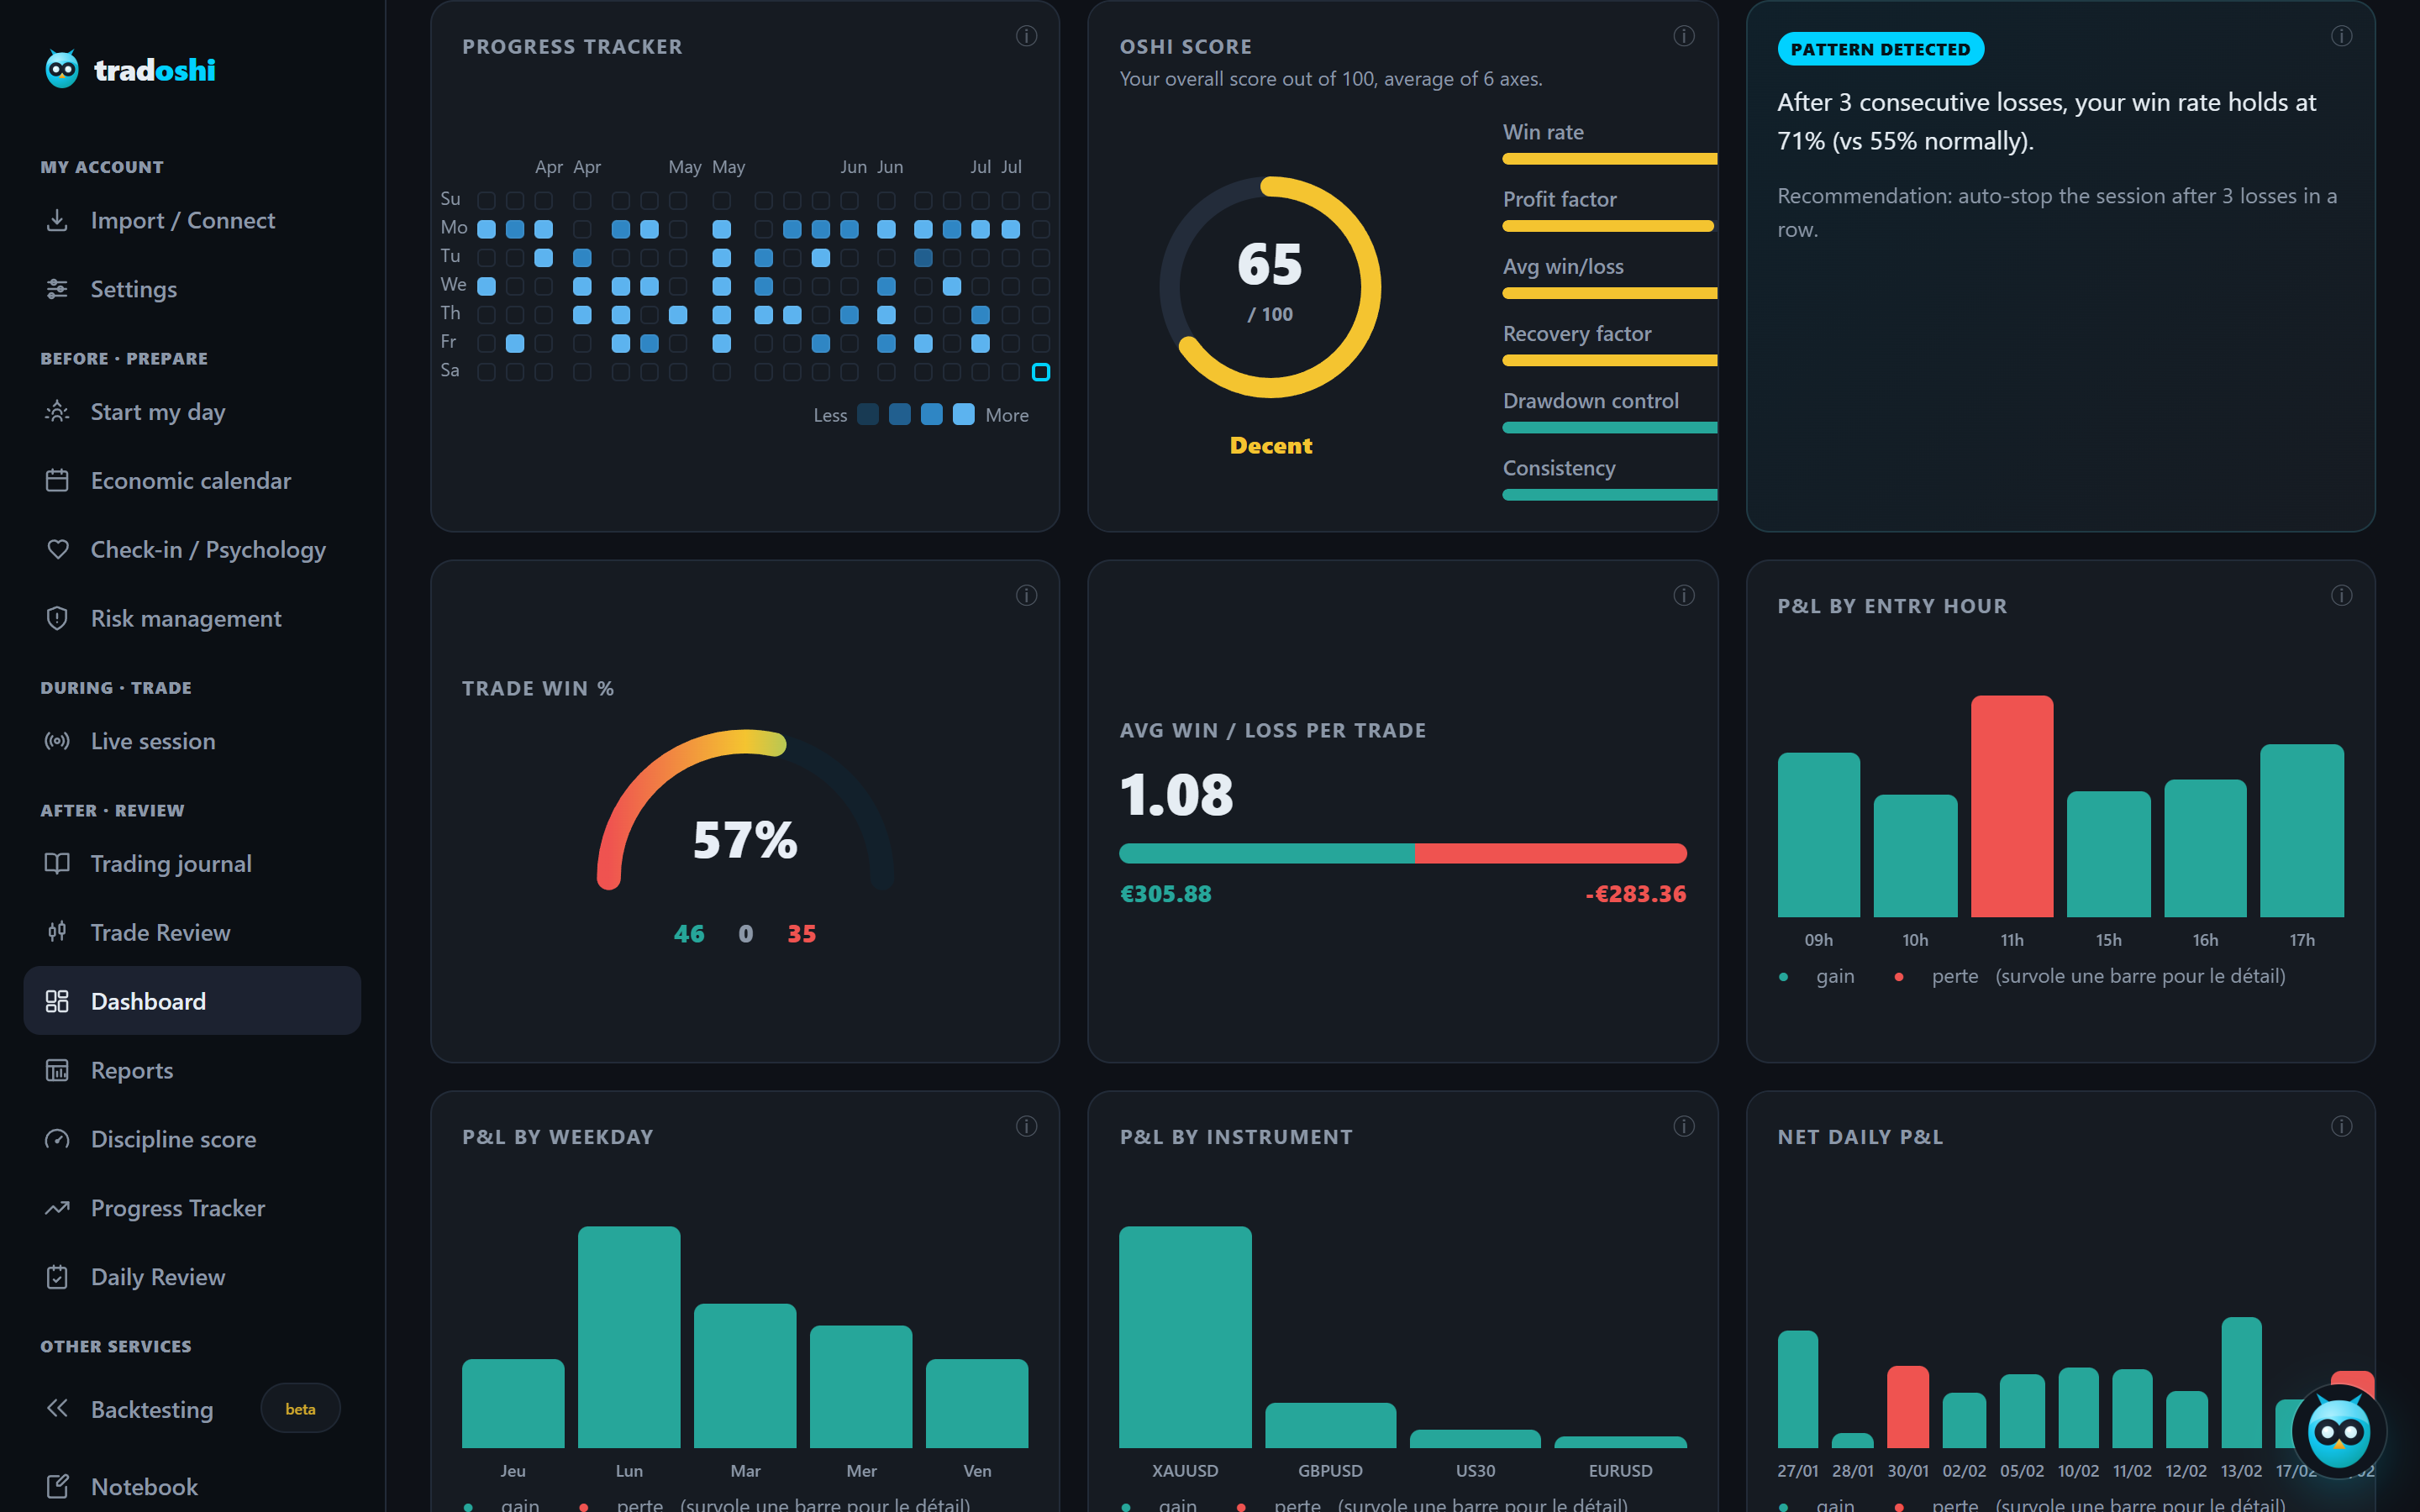
Tradoshi gives you your strategy's real statistics on your real trades, which extends and verifies your backtesting in live conditions. You compare your system's real behavior to its backtest benchmarks.
- Real statistics (win rate, profit factor, expectancy, average R) to compare to the backtest.
- Real drawdown and losing streak to verify they match your backtest benchmarks.
- Breakdowns by instrument and period to see where your strategy really holds.
- Tracking over time to detect whether your edge, validated in backtest, degrades live.
Frequently asked questions
What is backtesting in trading?
It's testing a strategy on past market data, applying its rules as if you had traded during that period, to see whether it would have been a winner before risking your money. It gives you your system's reference statistics (win rate, profit factor, drawdown, typical losing streak).
What is backtesting for?
First to filter bad ideas: a strategy that clearly loses in backtest doesn't deserve your capital, and knowing it before spares you real losses. Then to give you your system's normal-behavior benchmarks, letting you get through bad runs without panicking or quitting at the worst moment.
Does backtesting guarantee a strategy will win?
No. The past doesn't guarantee the future: a strategy that worked on history can fail live if market conditions change. Backtesting measures what happened, not what will happen. It's a filter that eliminates bad ideas more than it proves good ones, to be complemented by a forward test.
What is overfitting in backtesting?
It's refining your strategy so much that it fits the past data perfectly, becoming useless for the future. By adjusting too many parameters until a magnificent backtest, you model the period's randomness rather than a real edge. An overfitted strategy is complex and fragile: its results collapse as soon as you change the period a bit.
Backtest or forward test, should I choose?
Both are complementary. The backtest quickly eliminates bad ideas and gives benchmarks; the forward test (applying the strategy on data not used to build it, often on small size) confirms the edge holds outside the past used to calibrate it. Never commit serious capital based on a backtest alone.
Which statistics should I look at first in a backtest?
Win rate, profit factor, expectancy, maximum drawdown, and the typical consecutive losing streak. None of these five statistics is enough on its own: a high win rate with a profit factor close to 1 signals wins that are too small, and a severe maximum drawdown warns of real risk even if expectancy is positive on paper. Read them together.
What is data mining in backtesting?
It's testing dozens of variants of a strategy on the same data sample until you find one that works by chance. Statistically, if you test enough variations, you'll always eventually find one that looks excellent over that specific period, without that proving anything about its future value. It's a brute-force form of overfitting.
Does a backtest help calibrate position size?
Yes, and it's an often-overlooked use. Knowing your strategy's maximum drawdown and typical losing streak lets you set a coherent risk per trade: if nine consecutive losses are possible, risking 1% per trade gives a theoretical drawdown of roughly 9%, manageable, while risking 3% would push it to roughly 27%, a level few traders can handle without deviating from their plan.