A stock isn't just a ticker going up or down, it's a security tied to a real company, to a sector, to a quarterly earnings calendar, and sometimes to regulatory rules that flatly cap how many trades a small account can take. These extra layers demand a reading grid that a generic journal doesn't provide by default.
- Earnings dates and the opening gaps they cause form a separate risk category, to tag explicitly.
- Sector tagging reveals whether your edge is truly generalist or concentrated in a single industry.
- The pattern day trader rule caps how many round-trips a smaller account can take.
- Dividend dates are a minor but real factor to keep in mind, especially with options.
Stock trading stands apart from other instruments because every ticker is tied to a real company, with its own calendar events, sector dynamics, and, for smaller accounts in the US in particular, specific regulatory constraints on trade frequency. A journal that treats every stock as an interchangeable ticker misses these layers of information. That starts with understanding stock trading itself.
This guide details what a stock trading journal needs to track beyond a generic journal: earnings dates and gaps, sector, regulatory constraints on trade count, and dividend dates. The stock trade log Excel template columns cover all four.
Earnings and gaps, a risk category of their own
A stock can open several percent away from its previous close, a gap, generally triggered by a quarterly earnings announcement, sector news, or macro news that happened outside trading hours. This type of move has nothing to do with a normal intraday move: it jumps straight over your stop, making your usual risk management moot for that specific trade.
A rigorous stock journal should explicitly tag trades taken near or during an earnings window, because the risk profile simply isn't the same. A trader who blends their usual technical trades with trades taken intentionally or accidentally around an earnings announcement in the same statistics ends up with a distorted picture of their real edge on each of these two categories, which shouldn't be judged with the same yardstick.
Sector tagging, to see where your edge really lives
Many stock traders believe they have a generalist edge, applicable to any ticker, when in reality their performance is heavily concentrated in one or two sectors they know better or that fit their style better. Without a sector tag (tech, energy, healthcare, finance, consumer, and so on) in the journal, this concentration stays invisible.
| What the sector tag reveals | Why it's useful |
|---|---|
| Edge concentrated in one sector | You can specialize consciously instead of spreading focus thin |
| Underperformance in a specific sector | You can exclude it or adjust your sizing there |
| Dependence on a sector cycle | Understand why performance varies over time |
| Hidden correlation between positions | Several tickers in the same sector often move together |
That last point echoes a concern found in other markets under a different name: positions open on several tickers in the same sector can move together on a piece of sector news, turning what looked like three diversified bets into one concentrated bet. Sector tagging lets you spot that concentration before it turns into a grouped loss.
The pattern day trader rule and its consequences
In the US, regulation imposes specific constraints on smaller accounts that make more than a certain number of round-trips (buying and selling the same stock the same day) within a rolling five-business-day window, the so-called pattern day trader rule. An account classified as such must maintain a minimum equity, or the broker can restrict its ability to day trade.
This constraint has a direct consequence for how a trader with a smaller account should keep their journal: they need to track not just their result, but also the number of round-trips taken within the rolling five-day window, to avoid getting blocked at the worst moment. A trader who discovers this limit mid-active-session, rather than having anticipated it in their tracking, ends up having to change their plan under time pressure.
Dividend dates, a minor but real factor
Paying a dividend comes with a mechanical downward adjustment to the stock price on the day the shares trade without the dividend right (the ex-date). This move has nothing to do with the trade's technical or fundamental analysis and can distort a chart's reading if you don't know it happened, particularly on high-yield stocks where the adjustment is visible.
This factor matters particularly for traders using stock options, where dividend dates can influence contract valuation and sometimes trigger early exercise on short positions. Even for a purely stock trader with no options, keeping these dates in mind avoids misreading a mechanical move as a market signal.
Liquidity, very uneven from one stock to another
Unlike major forex pairs or the most-traded futures, liquidity varies enormously from one stock to another. A large-cap trades with a tight spread and comfortable market depth, while a small-cap can have a wide spread and a thin order book, making execution far more costly in practice than the price chart alone suggests.
A stock journal benefits from noting the market cap or liquidity category of the ticker traded, to check whether part of an underperformance comes from poorly anticipated execution cost on less liquid names, rather than an analysis error. It's an often-overlooked factor that can explain the gap between a setup's theoretical performance on paper and its real result once executed.
Watchlist size, a dispersion factor
The stock market offers a nearly unlimited choice of tickers, which pushes many traders to keep expanding their watchlist, convinced that more monitored opportunities means more trades taken and therefore more gains. In practice, it's often the opposite: a trader who seriously follows ten tickers develops a fine-grained read of their usual behavior, key levels and typical reaction to news, while a trader following a hundred tickers doesn't really know any of them in depth.
Tracking in your journal the number of different tickers traded over a given period, and crossing that figure with your performance, often reveals a tipping point: past a certain number of actively followed tickers, win rate degrades, a sign the watchlist grew faster than the real capacity to know each ticker well. Deliberately trimming the list after noticing this pattern is a simple decision that often improves performance without changing anything about the analysis method itself.
Day trading, swing and position: horizons not to mix
The stock market lends itself to very different holding horizons, from day trading that closes everything before the session ends, to swing trading that holds a position for several days, up to position trading that can stretch over several weeks or months. Each horizon follows a different risk logic: day trading avoids overnight gap risk, while swing and position trading accept it in exchange for a potentially larger move.
Mixing these horizons in the same statistics, without distinguishing them with an explicit tag, prevents you from knowing which one truly constitutes your edge. A trader might, for example, have an excellent win rate in swing trading but a neutral or negative result in day trading on the same tickers, a critical piece of information for directing time and energy, but one that stays invisible as long as the journal doesn't separate the two approaches.
How Tradoshi helps with your stock journal
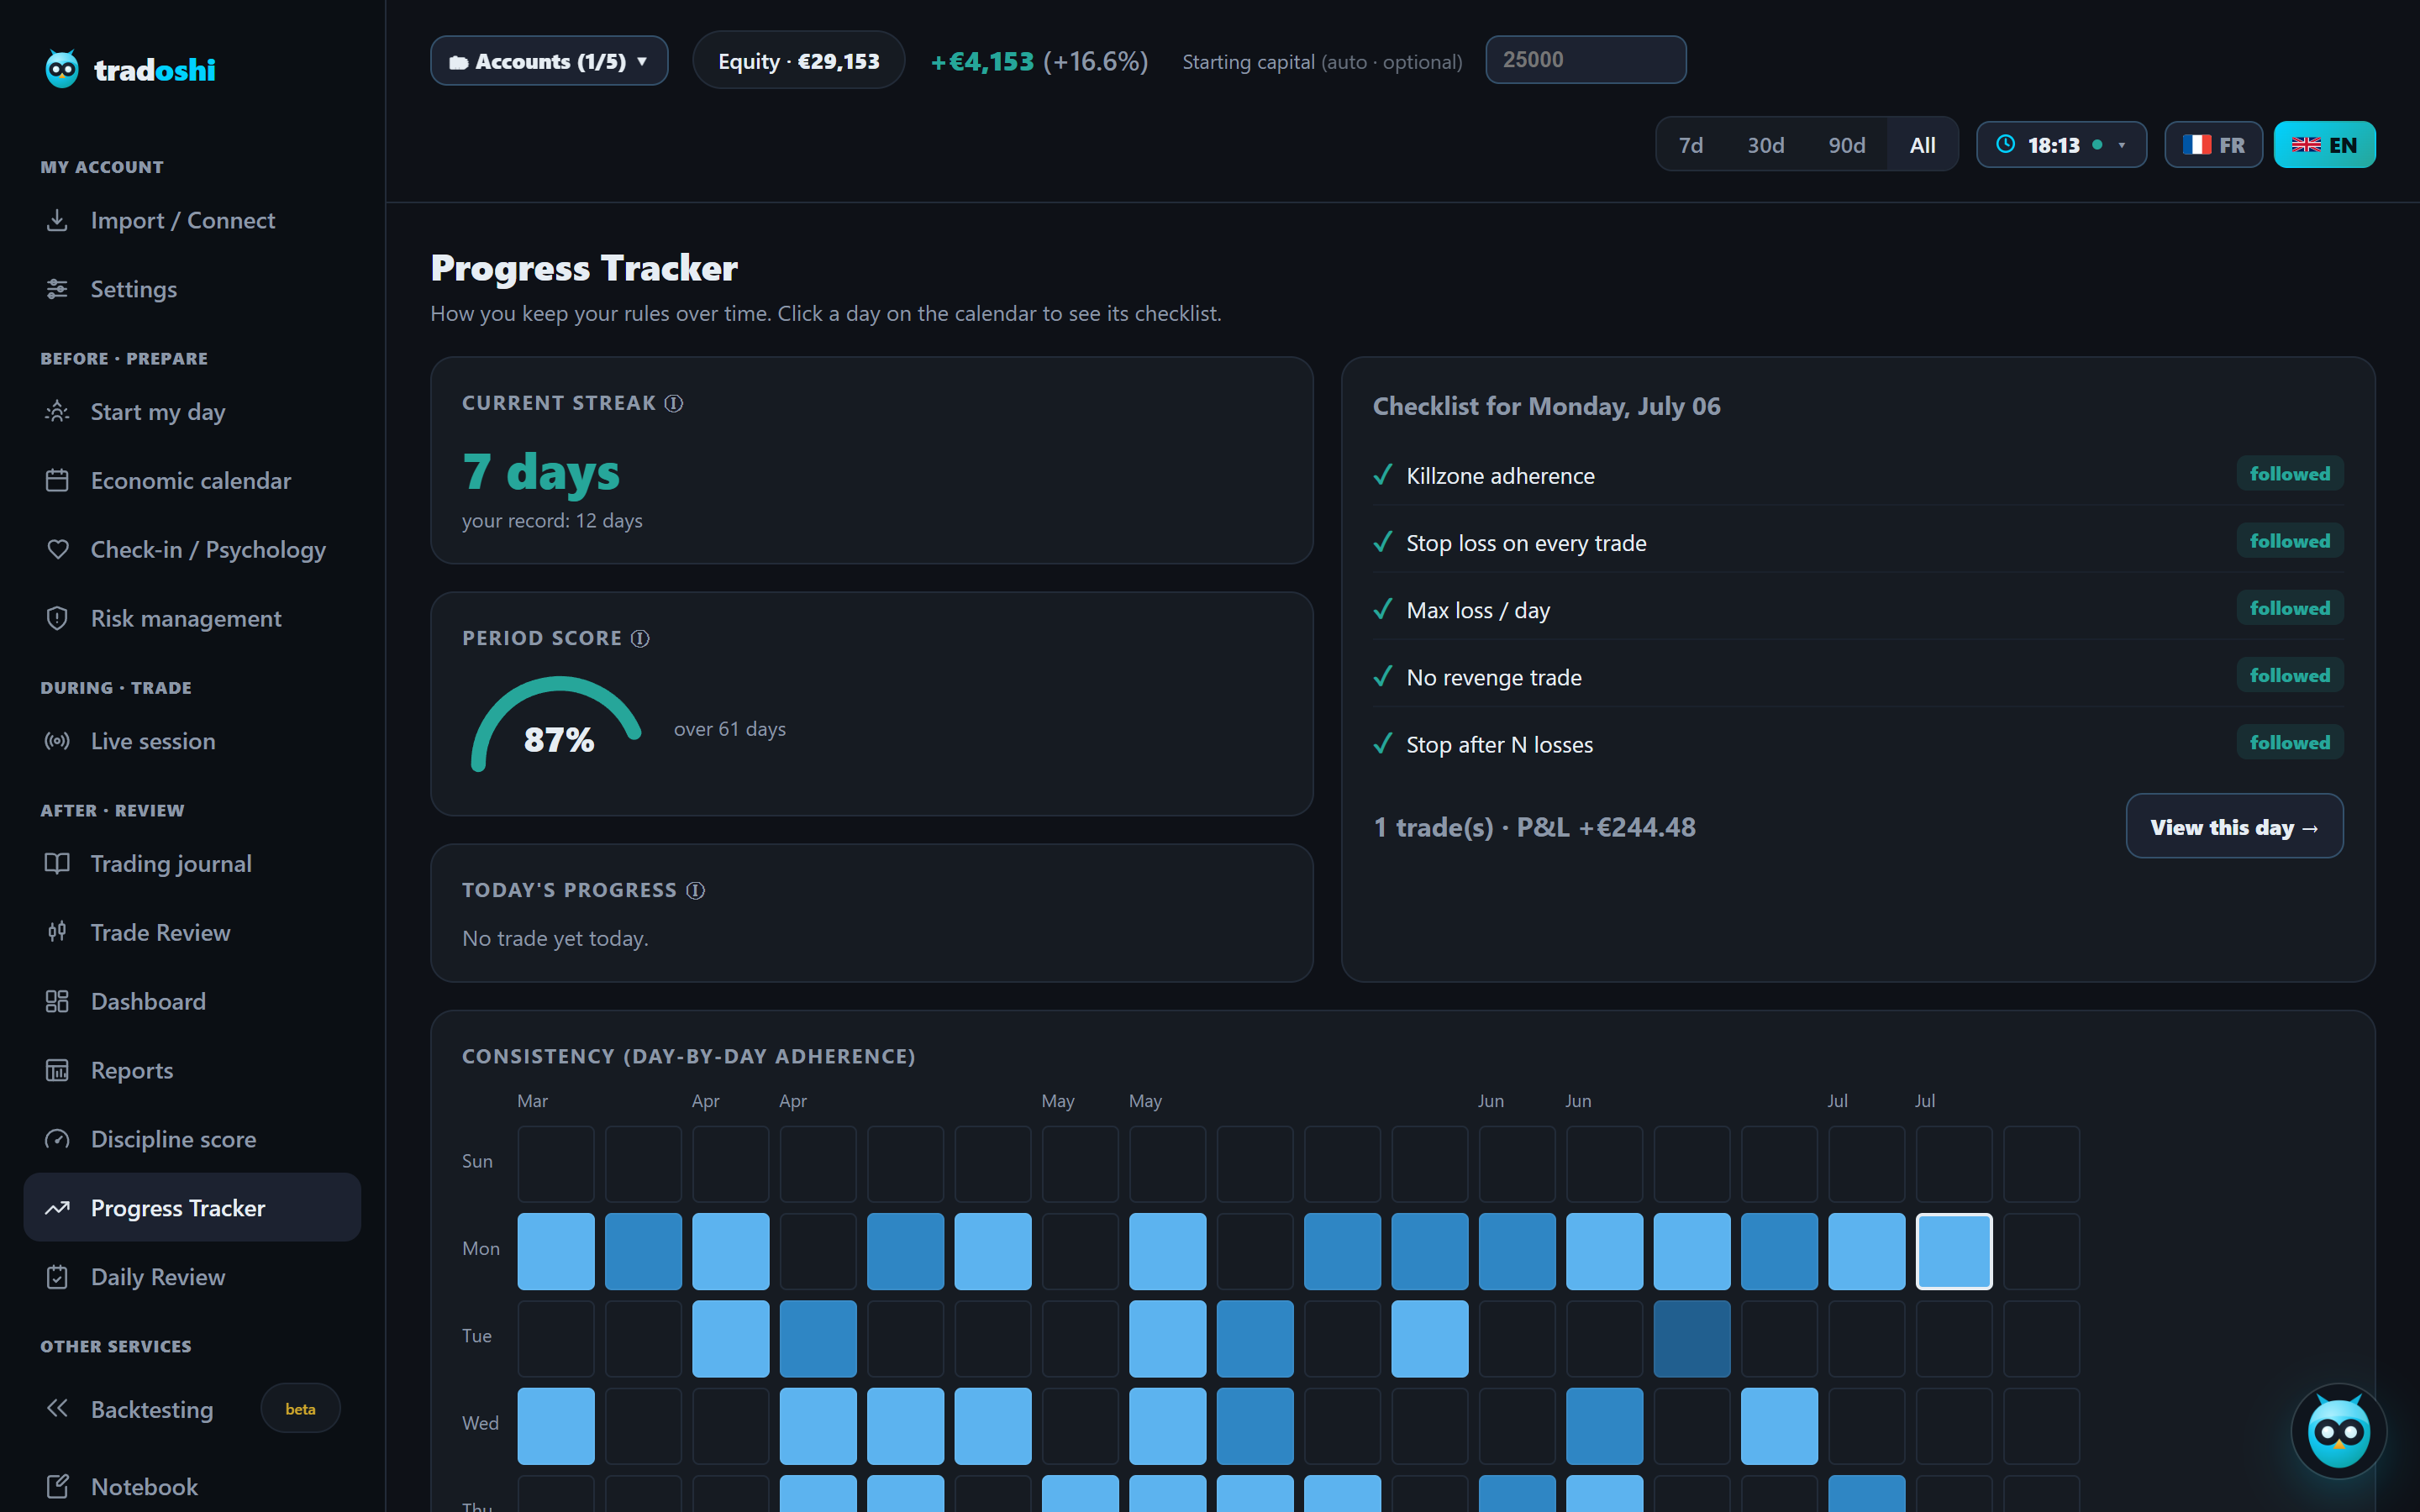
Tradoshi centralizes your stock trades with a journal that lets you tag the context specific to each trade, sector, earnings window, or any other category useful for your analysis, to reveal where your edge really lives rather than drowning it in a general average.
- Universal CSV import compatible with most stock brokers.
- Customizable tags to categorize sector, earnings window, or any other context.
- Per-tag statistics to compare your performance across categories.
- R-multiple and expectancy to judge your edge independently of position size.
Frequently asked questions
Why tag trades taken around earnings announcements?
Because an earnings announcement can trigger an opening gap that jumps straight over your stop, a completely different risk profile from a classic technical trade. Blending these two categories in the same statistics distorts the read of your real edge on each.
What's the point of sector tagging in a stock journal?
It reveals whether your edge is truly generalist or concentrated in one or two sectors. It also lets you spot hidden correlation between several positions in the same sector, which can move together on sector news and turn an apparently diversified bet into one concentrated bet.
What is the pattern day trader rule?
In the US, regulation requires smaller accounts that make more than a certain number of round-trips within a rolling five-business-day window to maintain a minimum equity. A trader with a smaller account needs to track their round-trip count to avoid getting restricted mid-session.
Do dividend dates actually matter?
It's a minor but real factor: the price mechanically adjusts down on the ex-date, a move unrelated to technical analysis. It's particularly relevant for stock options traders, where these dates can influence contract valuation.
Why track a stock's liquidity in my journal?
Because it varies enormously from one stock to another. A less liquid ticker has a wider spread and a thinner order book, making execution more costly than the chart alone suggests. Noting the liquidity category helps distinguish underperformance due to execution from underperformance due to analysis.
How does Tradoshi help analyze my stock trades by context?
Through customizable tags (sector, earnings window, or any other useful category) and statistics computed per tag, to compare your performance across categories and reveal where your edge really lives rather than drowning it in a general average.
Should I limit the number of tickers on my watchlist?
It's often a good idea. A trader who seriously follows around ten tickers develops a fine-grained read of their usual behavior, while a watchlist that's too broad dilutes that knowledge. Crossing the number of tickers traded with your performance in your journal often reveals a tipping point past which win rate degrades.
Should I separate day trading, swing and position trading in my journal?
Yes. These horizons follow different risk logics, notably around overnight gap risk. Mixing them without an explicit tag prevents you from knowing which one truly constitutes your edge, since a trader might perform well in swing but not in day trading on the same tickers.
What if my trades around earnings are consistently losing?
That's valuable information, not a failure to ignore. If the tag reveals a clear underperformance in that specific category, the most profitable decision is often simply to exclude positions opened near an earnings announcement, rather than keep searching for a technical fix that won't correct a problem of a different nature.
Does trading stock options require an even different journal?
Yes, to some extent. Beyond the underlying's price, an options position adds variables of its own like the expiration date, implied volatility at the time of opening, and the time-decay sensitivity that erodes an option's value as it nears expiration. A trader combining stocks and options benefits from separating these two categories in their journal, given how differently their risk mechanics work.
Should I account for market cap when analyzing my trades?
Yes, alongside the sector tag. A small cap can react disproportionately to minor news, while a large cap generally absorbs that kind of information better. Crossing market cap with trade results helps you understand whether your edge depends on a specific company size rather than an entire sector, a distinction that a sector tag alone won't always surface on its own.