There are dozens of trading statistics, and most are useless or, worse, misleading. Drowning in numbers is as dangerous as ignoring them. The truth is that a handful of statistics is enough to understand whether you're profitable and why. Here's which ones truly matter, how to read them together, and which to ignore.
- Few statistics truly matter: expectancy, profit factor, average R, drawdown.
- The win rate alone is misleading: never read it in isolation.
- Stats are read together, never one by one: they complement each other.
- Too many statistics drown the essential: aim for clarity, not exhaustiveness.
Facing a trading dashboard, many traders react in two opposite ways, both bad. Some ignore the numbers and trade on feel, depriving themselves of any objective measure. Others drown in dozens of indicators, unable to tell what matters from noise. The right approach is in the middle: knowing the few statistics that truly decide, and knowing how to read them together.
Not all statistics are equal. Some, like expectancy or profit factor, directly tell you whether your system wins. Others, like the isolated win rate, flatter your ego without teaching you anything useful. This guide gives you the short list of statistics that matter, explains what each measures, and above all how to combine them to understand your trading instead of getting lost in the numbers.
The statistics that truly matter
Of the dozens of possible numbers, only a handful deserve your daily attention. They're the ones answering the real questions: am I making money, by how much, with what quality, and at what risk? Here's the essential short list:
| Statistic | What it answers |
|---|---|
| Expectancy | Am I winning, and how much per trade? |
| Profit factor | Do my gains exceed my losses, and by how much? |
| Average R | What quality per unit of risk? |
| Max drawdown | What's my real risk, my worst pain? |
| Win rate + ratio | How do I win (often/small or rare/big)? |
Each of these statistics lights up a different facet of your trading, and together they give a complete picture. Expectancy and profit factor tell you whether you win. Average R tells you the quality of your trades. Drawdown tells you your risk. The win rate, read with the ratio, tells you your style. No other statistic is indispensable day to day: the rest is comfort or noise.
Expectancy and profit factor: are you winning?
These are the two king statistics, the ones answering the fundamental question: does my system make money? The profit factor relates the total of your gains to the total of your losses: above 1, you're profitable. Expectancy goes further by giving you your average gain per trade, which lets you project your performance. If you had to track only two numbers, these would be them.
These two statistics have a decisive advantage: they can't lie to you about your profitability, unlike the win rate. They incorporate both the frequency and the size of your gains and losses. A system can have a flattering win rate and a negative expectancy: in that case, expectancy tells the truth and the win rate lies. Always trust expectancy and the profit factor to judge whether you win.
Average R: quality per unit of risk
Average R (your expectancy expressed in units of risk) is serious traders' favorite statistic, because it measures the pure quality of your trades, stripped of the size effect. An average R of +0.4 means each trade returns, on average, 40% of your risk. It's a number comparable over time, whatever the evolution of your capital or your position sizes.
The advantage of average R over expectancy in money is that it lets you compare periods where your sizes were different, and reason about your edge independent of your risk management. It cleanly separates the question 'is my system good?' (the R) from the question 'how much do I bet?' (the size). It's the ideal unit of account for judging the quality of your trading over time.
Drawdown: risk and survival
No gain statistic suffices without a risk statistic, and maximum drawdown is the most important of them. It measures the worst drop your capital suffered, and therefore your worst pain, the one that can make you quit or ruin you. A system can have a nice expectancy and an unbearable drawdown: in that case, it isn't really usable, because you won't hold it.
Gain statistics tell you if the system is worth it. The drawdown statistic tells you if you'll be able to hold it. Both are necessary.
That's why you must always read your gain statistics next to your drawdown. A system with a nice expectancy but high drawdown is more dangerous than one with a more modest expectancy but controlled drawdown. The ratio between your performance and your drawdown is a far better judge of a system's quality than performance alone, which always flatters.
The statistics to ignore
As much as knowing which statistics to watch, you must know which to ignore. The win rate read alone is the first: it flatters without teaching. Beware too of statistics too sensitive to a single trade (like the biggest gain), exotic ratios you can't interpret, and any statistic computed on too few trades to be reliable. A nice statistic on ten trades is worthless.
The golden rule is clarity before exhaustiveness. A dashboard overloaded with dozens of indicators doesn't make you better, it drowns the essential in noise and stops you from seeing what matters. Better to track five statistics you understand and use to decide, than fifty you look at without ever acting on. In trading as elsewhere, useful information is the kind that changes a decision.
Behavior statistics, often forgotten
Most traders only track performance statistics (win rate, profit factor, average R), forgetting an equally important category: behavior statistics. How many times did you respect your stop? How many trades were off-plan? What's your revenge-trading frequency? These numbers, which measure your discipline rather than your results, are often more revealing than performance statistics, because they point to the cause rather than the consequence.
Tracking your behavior statistics transforms how you progress. While performance statistics tell you whether you win, behavior statistics tell you why, and above all what to act on. A trader who discovers they breach their stop in 30% of their trades knows exactly which habit to correct to improve their results. These behavioral statistics are the missing link between your performance numbers and the concrete actions that will improve them.
Crossing statistics with emotions
A powerful and rarely exploited dimension consists of crossing your statistics with your emotional state. By linking your results to what you felt (stressed, confident, tired, euphoric), you surface patterns otherwise invisible: maybe your stressed days have a clearly lower expectancy, or your win rate collapses when you're tired. These correlations between emotion and performance are among the most precious discoveries a trader can make.
This crossed analysis turns a vague intuition ('I think I trade badly when stressed') into exploitable data ('my expectancy is half as much on days I report being stressed'). Once this correlation is established, the action is obvious: don't trade, or trade small, in these states. Crossing statistics and emotions is exactly what differentiates a mere accounting of trades from a real understanding of how you operate, and it's often where your biggest performance gains hide.
Avoiding analysis paralysis
The downside of statistical tracking is real: measuring too much can paralyze you. Some traders spend more time analyzing their numbers than trading, or let themselves be so influenced by the slightest variation in their statistics that they constantly question their system. Too much poorly-used data produces noise and anxiety, not clarity. Statistics should serve the decision, not replace or drown it.
The good practice is to track few statistics, but track them regularly and act on them. Set a review rhythm (weekly or monthly) rather than scrutinizing your numbers after every trade, which makes you a slave to short-term variance. A statistic is only useful if it changes a decision; if you look at it without ever doing anything, it brings you nothing. The goal isn't to measure everything, but to measure the little that matters and draw concrete actions from it.
Comparing your statistics over time, not just in absolute terms
An isolated statistic, taken at a single point in time, doesn't say much. What truly matters is its trend: is your expectancy improving, stagnating, or degrading over the last three months compared to the previous three? A trader whose profit factor goes from 1.3 to 1.6 in six months is progressing, even if 1.6 remains modest in absolute terms. Conversely, a trader whose win rate stays steady at 55% while their expectancy quietly drops is going through a degradation that a simple glance at today's number never reveals.
Comparing your statistics over time requires tracking them over consistent windows, month by month or quarter by quarter for instance, rather than constantly rolling them over your entire history, which dilutes recent trends. This time-based reading turns your statistics from a frozen snapshot into a steering tool, capable of flagging an emerging problem before it becomes a real hole in your account.
Statistics by session, instrument, and setup
Beyond your overall statistics, breaking them down by subcategory often reveals considerable performance gaps that the general average completely masks. You might be profitable on indices and losing on forex, strong during the London session and mediocre during the Asian session, excellent on your continuation setups and barely breakeven on your reversal setups. The overall average smooths out these gaps and gives you a false impression of uniformity.
This breakdown is one of the most profitable exercises a trader can do, because it turns a vague overall improvement goal ('I need to trade better') into a precise, immediate action ('I stop trading the Asian session' or 'I reduce my size on my reversal setups'). Many traders try to improve everywhere at once when they'd gain more, faster, by simply cutting the categories that are losing them money.
Survivorship bias in your own statistics
A common trap is judging your system's quality only from the trades you actually took, forgetting all the valid setups you let pass out of excessive caution, or conversely all the trades you narrowly avoided after a recent bad experience. This invisible selection distorts your statistics without you realizing it: your displayed win rate can be far better, or far worse, than your actual system's, simply because you're not taking every signal it generates.
To limit this bias, also log the valid setups you didn't take and why, at least during an observation period. If you discover you systematically avoid a certain type of configuration even though it's statistically winning, or conversely that you habitually take signals your system doesn't really recommend, your official statistics no longer reflect your real edge but a version filtered by your own biases. Fixing this gap between the theoretical system and the system you actually execute is a step few traders take, and yet it pays off considerably.
How Tradoshi gives you the essentials
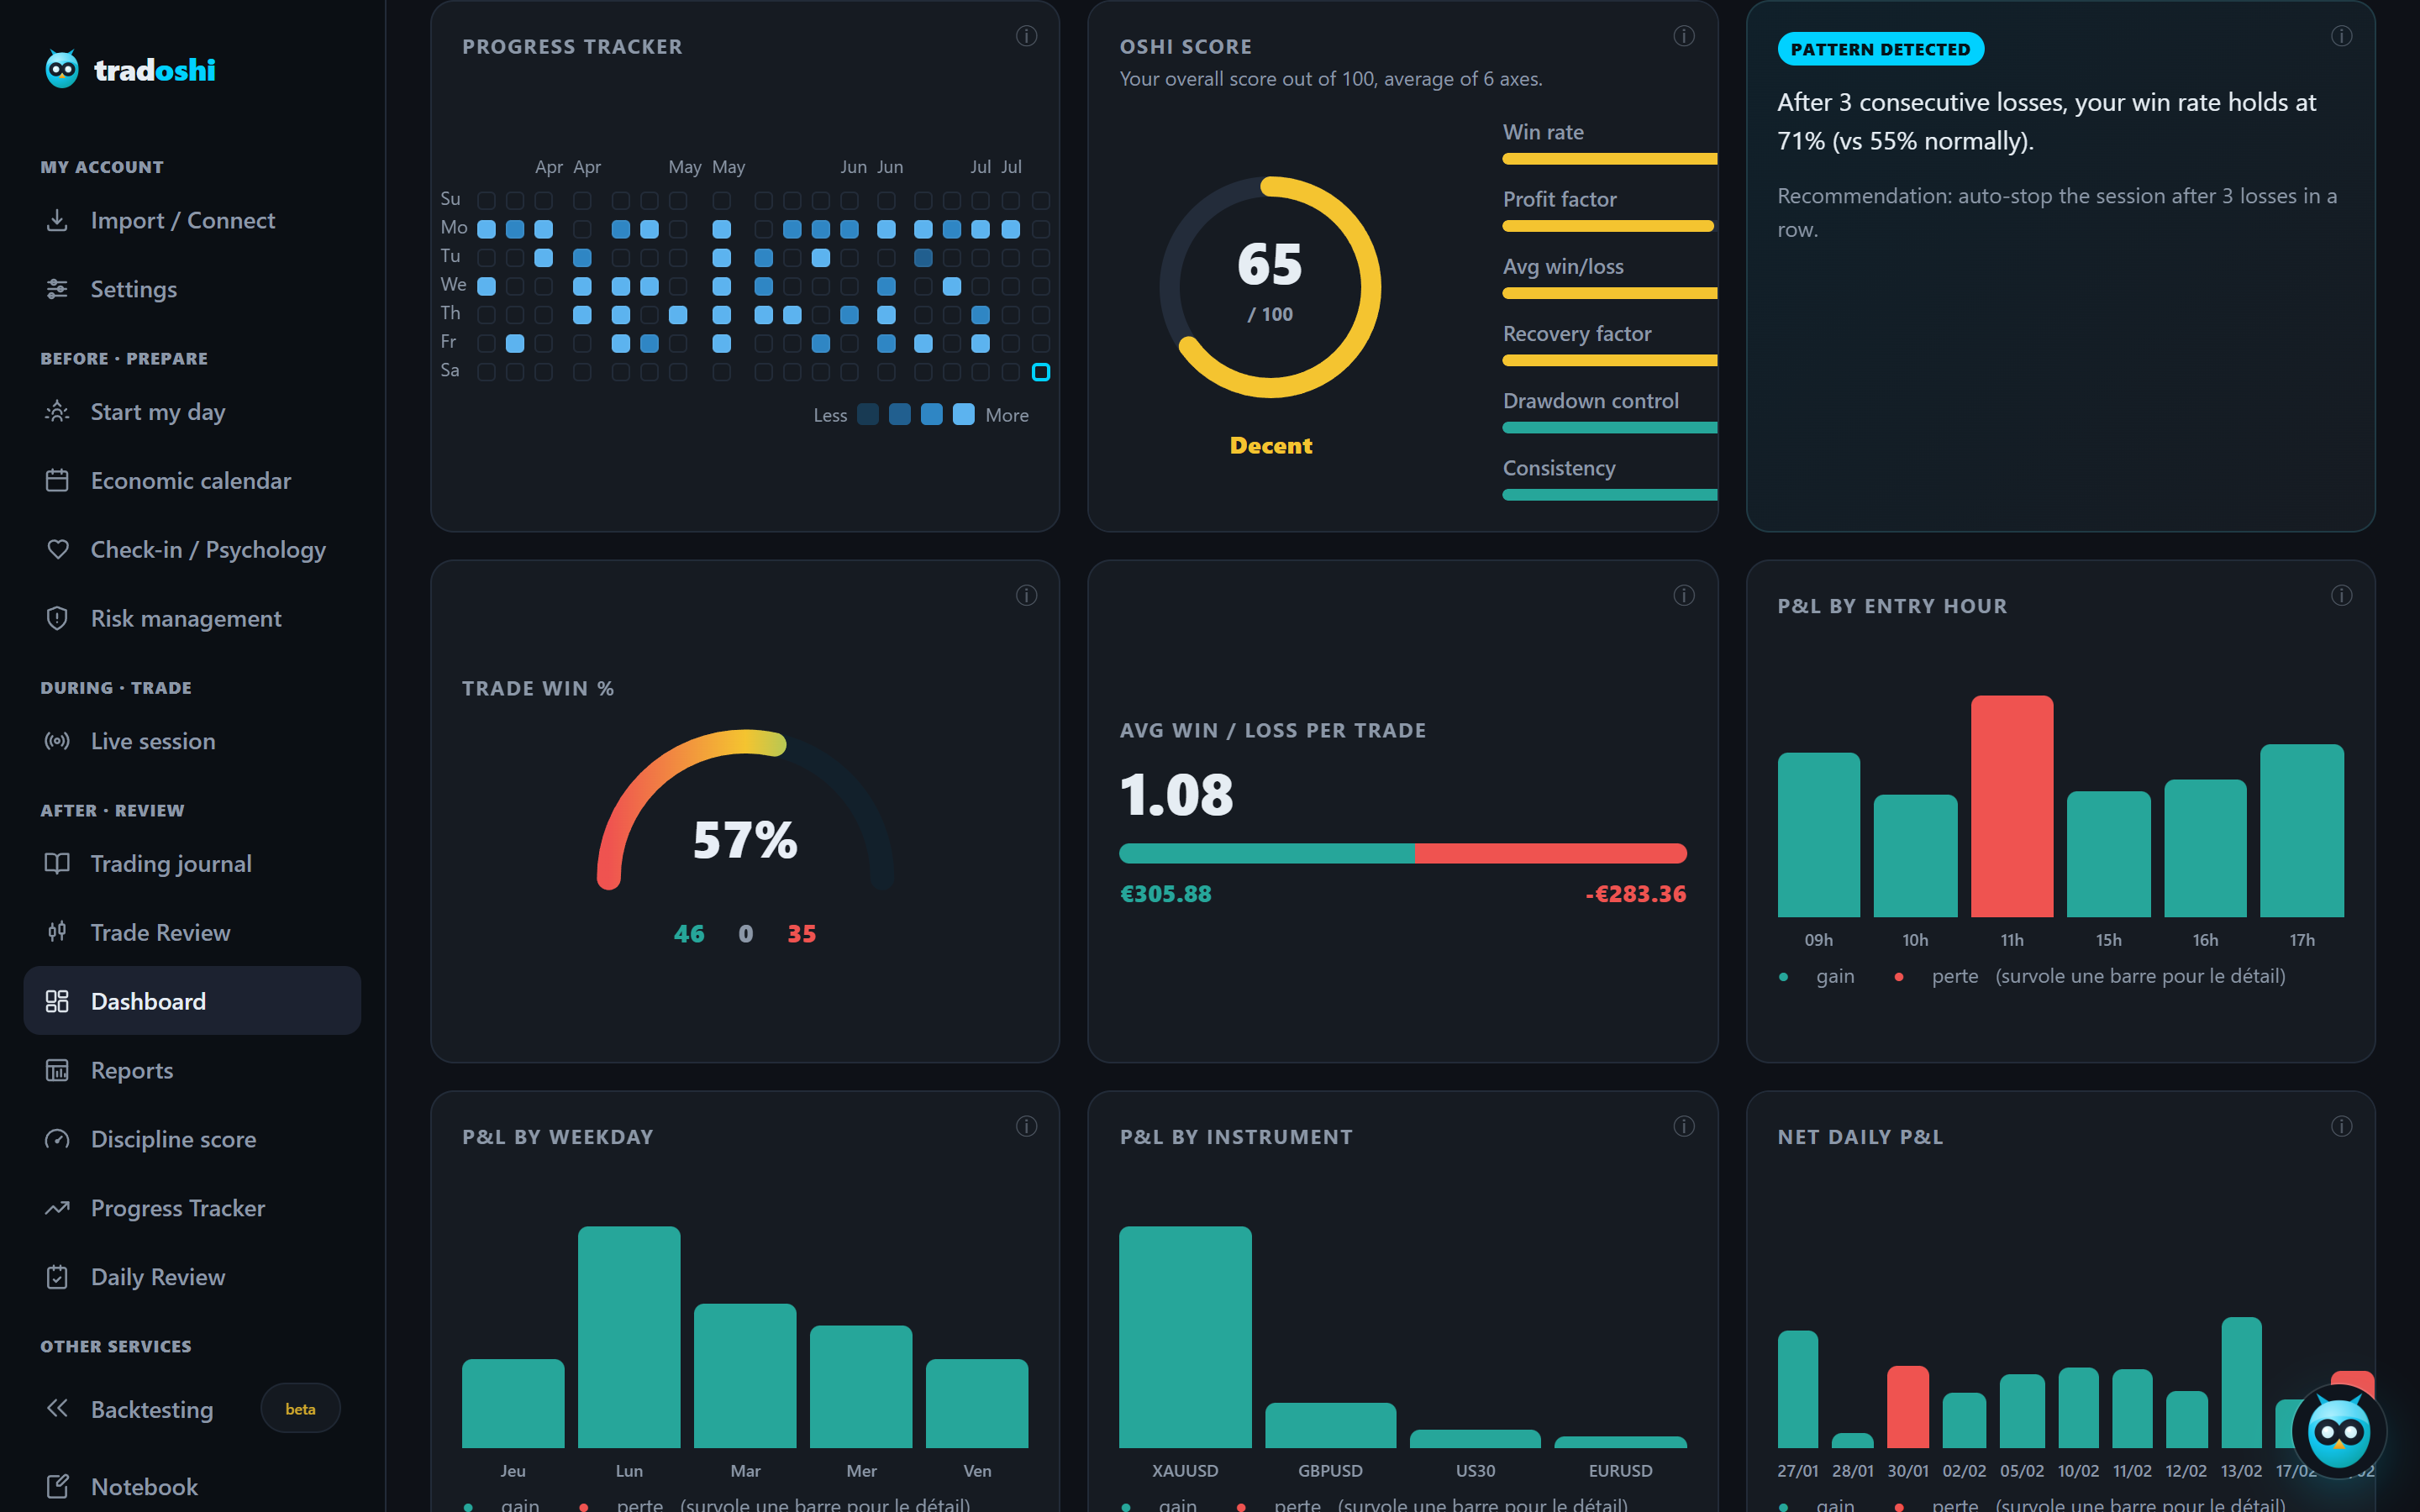
Tradoshi automatically computes the statistics that matter on your real trades and presents them together, so you understand your trading instead of drowning in the numbers.
- Expectancy and profit factor: the two judges of your profitability, computed on your real trades.
- Average R: the quality of your trades per unit of risk, comparable over time.
- Current and max drawdown: your risk and survival statistic, shown with your gains.
- Oshi Score: a synthesis of the axes that matter, to read the essentials at a glance.
Frequently asked questions
Which trading statistics truly matter?
A handful suffice: expectancy (are you making money, and how much per trade?), profit factor (do your gains exceed your losses?), average R (what quality per unit of risk?), maximum drawdown (what risk, what worst pain?) and the win rate read with the ratio (how you win). The rest is comfort or noise.
Why not rely on the win rate alone?
Because it flatters without teaching anything useful: it measures the frequency of your gains, not their size. You can win 80% of your trades and lose money if the rare losses are huge. The win rate is never read in isolation, always with the gain/loss ratio or, better, replaced by expectancy and profit factor which can't lie to you.
What's the most important statistic?
Expectancy, because it directly answers the fundamental question: does my system make money, and how much per trade? But it must always be read next to the maximum drawdown, which measures your risk and your ability to hold. Gain statistics tell you if the system is worth it, drawdown tells you if you'll be able to hold it.
Should I track many statistics?
No, on the contrary. Too many statistics drown the essential in noise and stop you from seeing what matters. The golden rule is clarity before exhaustiveness: better to track five statistics you understand and use to decide, than fifty you look at without ever acting on. Useful information is the kind that changes a decision.
What is average R and why track it?
Average R is your expectancy expressed in units of risk: an average R of +0.4 means each trade returns on average 40% of your risk. It measures the pure quality of your trades, stripped of the size effect, which makes it comparable over time whatever the evolution of your capital. It's serious traders' favorite unit of account.
On how many trades is a statistic reliable?
You need a sufficient sample for a statistic to be credible: a nice expectancy on ten trades is worthless, because variance dominates. Generally, you start trusting your statistics beyond several dozen trades, ideally a hundred or more. Beware any number computed on too few trades, it mainly reflects luck.
Should I look at my statistics in absolute terms or over time?
Both, but the trend over time is often more revealing. A profit factor going from 1.3 to 1.6 in six months shows real progress, even if the number stays modest. A steady win rate hiding a silently declining expectancy is a trap only a time-based reading, by month or quarter, lets you catch in time.
Why break down statistics by instrument or session?
Because the overall average often hides huge gaps: you might be profitable on one instrument and losing on another, strong in one session and mediocre in another. This breakdown turns a vague improvement goal into a precise action, like dropping a session or setup that systematically loses you money.