Few tools are as widespread as the moving average for gauging a trend and triggering an entry or exit. Its popularity comes from its simplicity: a single line, calculated from past prices, that smooths out market noise. But that simplicity hides a real trap, the time lag, and its very popularity makes it a tool worth understanding in depth before relying on it blindly.
- Simple (SMA) and exponential (EMA) differ in the weight given to recent prices; the EMA reacts faster.
- A moving average is used to gauge trend: price position relative to the line, and the slope of the line itself.
- Crossing two moving averages is a common signal technique, with a well-known inherent lag.
- Lag is a real, documented limitation: better to combine moving averages with other confirmation than trade them alone.
The moving average is probably the first technical indicator any beginning trader encounters, since it's present on practically every platform and every tutorial. Its promise is simple: smooth out erratic price fluctuations to reveal a more readable direction, the underlying trend, to base an entry or exit decision on.
This guide explains the difference between simple and exponential moving averages, how they're used to gauge a trend, how crossovers work as signals, the well-known limitation of lag, and why practical wisdom is to combine them with other confirmation rather than trade them alone.
Simple or exponential moving average: what changes
The simple moving average (SMA) calculates the arithmetic mean of closing prices over a given number of periods, giving exactly equal weight to every price in the period, whether recent or older. A 20-period SMA, for instance, adds up the last 20 closing prices and divides by 20, with no distinction between yesterday's price and one from three weeks ago.
The exponential moving average (EMA) applies a different weighting: it gives more weight to the most recent prices, and a declining weight to older ones. In practice, this means an EMA reacts faster to a recent price change than an SMA calculated over the same period, since it 'listens' more to what just happened. This added reactivity cuts both ways: it reduces lag but also increases sensitivity to short-term noise.
| Type | Behavior |
|---|---|
| SMA (simple) | Equal weight to every price; smoother, reacts more slowly |
| EMA (exponential) | Heavier weight on recent prices; reacts faster, but more sensitive to noise |
Using a moving average to gauge trend
The most basic use of a moving average is observing price position relative to it. A price that trades durably above its moving average is generally read as a sign of an uptrend; a price that trades durably below, as a sign of a downtrend. This simple reading often serves as a context filter, even before looking for a more precise entry signal.
The slope of the moving average itself gives a second useful piece of information: an average rising sharply reflects an accelerating trend, while a flattening average reflects a slowdown or a range phase, even if price stays technically above it. Combining position and slope gives a richer reading than a simple binary observation of above or below the line.
Moving average crossovers as a signal
A very common technique uses two moving averages of different periods, a short one and a long one, and watches their crossovers. When the short average crosses above the long one, some traders read it as a buy entry signal; when it crosses below, a sell entry or exit signal. It's a mechanical technique, easy to automate, which explains its popularity, particularly among traders new to technical analysis.
It's important to describe this technique for what it is, a common signal tool, rather than claim that a particular crossover 'works' reliably. Moving average crossovers suffer from a well-known limitation, widely documented in technical literature: their inherent time lag, which can generate late signals, especially in markets that alternate quickly between trending and range phases.
The lag problem
Every moving average, by construction, is calculated from past prices. By nature, it can therefore only react after price has already moved, never before. This delay, called lag, is a structural characteristic of the tool, not a settings flaw that could simply be fixed by changing the period used. A shorter period reduces lag but increases noise; a longer period reduces noise but increases lag. There's no setting that eliminates this trade-off.
This lag poses a particular problem in ranging markets, where price oscillates with no clear direction: moving average crossovers can then multiply, generating repeated entry and exit signals, often just before price reverses direction again, a phenomenon sometimes called 'false signals' or 'whipsaw'. It's precisely in these phases that the structural weakness of pure crossover technique shows up most clearly.
An illustrative example
Imagine a market entering a clear, sustained uptrend: a short EMA crosses above a long EMA shortly after the move begins, and price keeps rising for several weeks. In this illustrative scenario, the crossover signal, despite its inherent lag, would still have captured a good portion of the move, because the trend lasted far longer than the signal's delay.
Now imagine the same pair of moving averages applied to a market oscillating in a tight range for several weeks, with no clear direction. In this second illustrative scenario, the two averages cross and re-cross repeatedly, generating a series of signals that mostly cancel out in small losses, because the lag gets the trader in right as the move is already running out of steam. The same tool, the same method, produces radically different results depending on the market regime, which illustrates well why a crossover alone isn't enough as a complete method.
Combining moving averages with other confirmation
Given this well-known limitation, the more careful practice is not trading a moving average crossover in isolation, but combining it with other confirmation elements before triggering an entry. This can include a reading of price structure (a break of a significant level), volume context, or any other element that reinforces the probability that the moving average signal isn't just a false signal generated by a range phase.
Many traders also use moving averages less as a direct trigger than as a context filter: only taking buy entries, sourced for instance from an entirely different method, when price trades above a reference moving average, without using the crossover itself as the entry signal. This approach captures part of the tool's usefulness (trend reading) while reducing exposure to its main weakness (lag on the crossover signal).
The most common periods and their logic
Certain moving average periods come up very often among technical traders, without any of them being a universal truth: the 20-period for a short-term trend reading, the 50 for an intermediate trend, and the 200 for the underlying trend on higher timeframes. These periods owe their popularity as much to their widespread use, which creates a kind of self-fulfilling effect when many participants watch them at the same time, as to any demonstrated mathematical superiority over other nearby values.
There's no 'correct' period in the absolute: the right choice depends on the trading horizon, the instrument, and above all how the trader intends to use it, as a context filter or as a direct trigger. A scalper and a swing trader who both use a moving average generally have no reason to choose the same period, since their very definition of the 'relevant trend' doesn't operate on the same time scale.
Moving averages and risk management
Beyond their use as an entry signal, moving averages also sometimes serve as a reference for placing a stop or managing a gradual exit. A trader in a position might, for example, choose to exit as soon as price closes clearly on the other side of a reference moving average, which offers an objective, easy-to-apply exit rule rather than a decision made on feel mid-trade.
This use for exit management inherits, however, the same limitations as its use as an entry signal: lag means an exit based on a moving average always occurs after the opposing move has already begun, mechanically giving up part of the gain already banked. It's an accepted trade-off rather than a flaw to fix: the rule has value precisely because it's simple and objective, even though it never optimizes the exact exit point.
How Tradoshi helps
Whatever your entry method, moving averages, price zones or any other technical approach, the question that matters stays the same: does it produce a measurable result over time, in the market conditions where you actually trade? Tradoshi doesn't take sides on which moving average setup to use, but it gives you the means to objectively check whether your entries based on these signals give you an edge, and in which market regime.
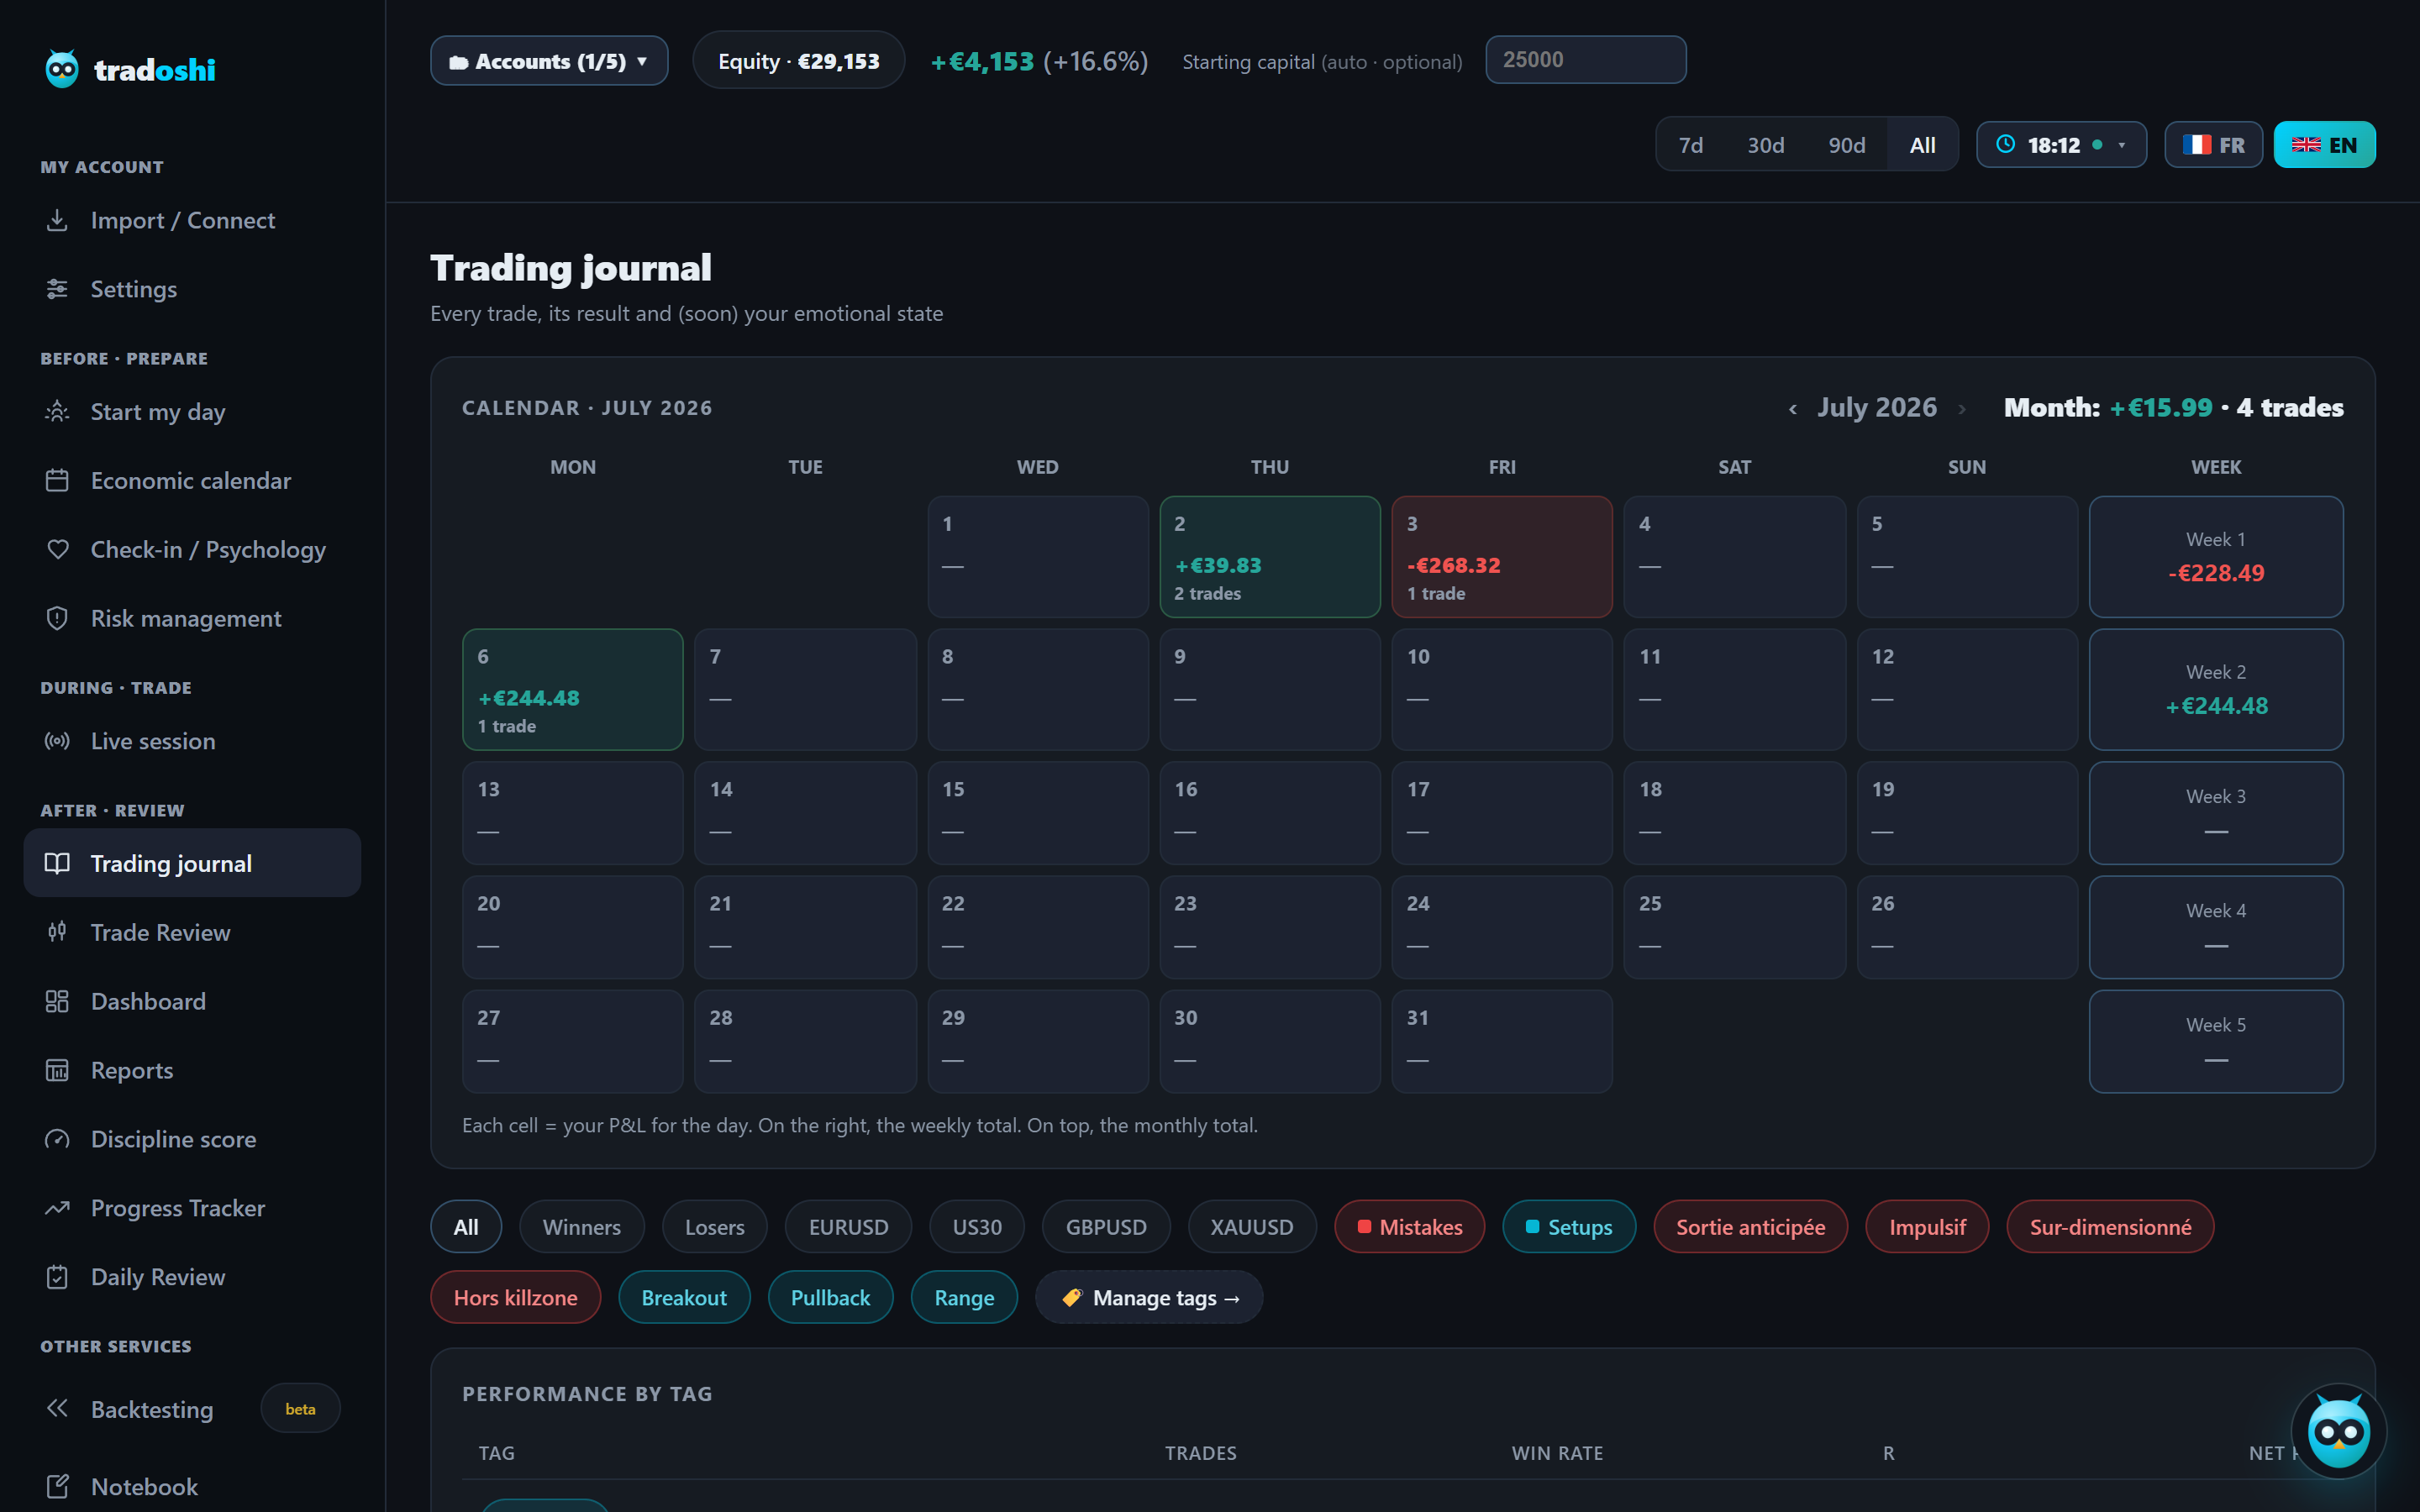
By tagging your trades taken on a moving average signal, with or without extra confirmation, you can compare their respective results and identify whether your crossovers work better in trending conditions than in a range, a distinction that only rigorous tracking over time can truly reveal.
- Per-trade setup tags: separate your crossover-only entries from your entries with extra confirmation.
- Stats by tag: win rate and average R-multiple compared by market context (trend or range).
- Detailed journal: note the market regime identified at the time of the trade to refine your reading over time.
- Market replay: revisit price history to verify after the fact how reliable your signals actually were.
Frequently asked questions
What's the difference between simple and exponential moving averages?
The simple moving average (SMA) gives equal weight to every price in the period. The exponential moving average (EMA) gives more weight to recent prices, making it more reactive to a recent change, at the cost of increased sensitivity to short-term noise.
How do you use a moving average to gauge trend?
By observing price position relative to the line (above generally read as bullish, below as bearish) and the slope of the average itself, which reflects an acceleration or slowdown of the trend.
What is a moving average crossover?
It's a technique that watches two averages of different periods, a short one and a long one. The short one crossing above the long one is often read as a buy signal, and the reverse as a sell signal. It's a common signal tool, not a guaranteed method.
What's the lag problem with moving averages?
Every moving average is calculated from past prices, so it can only react after price has already moved. This lag is structural: a shorter period reduces it but increases noise, a longer period reduces noise but increases the lag.
Why do crossovers generate false signals in a range?
In a market oscillating with no clear direction, the two averages cross and re-cross repeatedly, often just before price reverses direction because of the lag, generating a series of signals that cancel out in small losses.
Should you trade moving average crossovers alone?
The more careful practice is combining them with other confirmation (price structure, volume, other context) rather than trading them in isolation, or using them as a trend filter rather than a direct entry trigger.
Which moving average period should you choose?
There's no universally correct period: the 20, 50 and 200 periods come up often among technical traders, but the right choice depends on the trading horizon (scalping, swing) and the intended use, as a context filter or direct trigger.
Can a moving average be used to place a stop?
Yes, some traders exit as soon as price closes clearly on the other side of a reference average, an objective and easy-to-apply rule. It inherits the same lag as when used for entries though, mechanically giving up part of the gain already banked.