The R-multiple is probably the smartest way to measure your trades, yet most traders never use it. Instead of counting your gains in money, you count them in units of risk: how many times your initial risk did this trade return? That simple shift transforms how you judge your performance and makes all your trades comparable on one scale.
- 1 R = your initial risk on a trade, the distance between your entry and your stop.
- Counting in R makes all your trades comparable, whatever their size.
- R reveals your real performance: +0.6 R average says more than your raw P&L.
- It shifts the focus to risk, not money, the right way to think.
When you measure your trades in money, you compare incomparable things. A gain of 200 on a trade where you risked 50 has nothing to do with a gain of 200 on a trade where you risked 400. The first is an excellent trade, the second a mediocre one, but in money they look alike. That confusion pollutes your judgment and stops you from seeing what really works.
The R-multiple solves this at once. By expressing each result in multiples of your initial risk, it puts all your trades on the same scale and tells you, regardless of size, the quality of each trade in terms of gain/risk ratio. This guide explains what an R is, how it transforms your reading of your performance, and why it's the unit of account of serious traders.
What an R is
An R is your initial risk on a trade: the distance between your entry price and your stop loss, expressed in money. If you enter at 100 with a stop at 98, your risk is 2 per unit, and that value becomes your 1 R for this trade. Everything else is then measured in multiples of this R: a 4 gain on this trade is +2 R, a 6 gain is +3 R, and if your stop is hit, you make -1 R.
The beauty of R is that it normalizes. It doesn't matter whether you risked 50 or 500 on a trade: expressed in R, a trade returning twice your risk is a +2 R, whether that's 100 or 1,000 in absolute terms. R erases size and keeps only what really matters: the ratio between what you won and what you risked. It's the unit that finally makes your trades comparable to each other.
Why counting in R changes everything
Counting in money mixes two pieces of information: the trade's quality and its size. A big gain can come from an excellent trade or simply from a big position on a mediocre one. In money, you can't tell them apart, and you risk congratulating yourself on a bad trade just because you bet big, or underestimating an excellent trade just because you bet small.
In money, you see how much you won. In R, you see if you traded well. They're two different questions, and only the second makes you improve.
R separates these two dimensions. It tells you the pure quality of each trade, stripped of the size effect. So you can honestly compare a trade from six months ago, when your account was smaller, with a trade from today. You can add up your R over a period to know your performance in units of risk, a far more telling number than your raw P&L, because it doesn't depend on the size you took.
R for judging your strategy
Add up your R over a set of trades and you get your expectancy in R: your average gain per trade, expressed in units of risk. If you average +0.4 R per trade, it means each trade returns, on average, 40% of your risk. It's an extraordinarily useful number, because it tells you how much your edge is worth per trade, regardless of the size you take.
| Expectancy in R per trade | Interpretation |
|---|---|
| Negative | Losing system: each trade costs on average |
| Around 0 | No edge: you're flipping a coin |
| +0.2 to +0.4 R | Real, exploitable edge |
| Above +0.5 R | Excellent edge |
This measure also lets you project: if your expectancy is +0.3 R and you take 100 trades, you can expect +30 R over the period. All that's left is to decide how much your R is worth in money (your position size) to know your expected performance. R thus decouples your strategy (the edge, in R) from your risk management (the size, which converts R into money).
R shifts your focus to risk
Beyond measurement, thinking in R changes your psychology. When you reason in money, your attention is captured by the money, which activates fear and greed. When you reason in R, your attention goes to risk, which is exactly the right way to think in trading. You no longer ask 'how much will I make', you ask 'how many R is this trade worth', i.e. what's its gain/risk ratio.
This shift is subtle but powerful. A trader who thinks in R naturally accepts a -1 R loss as a normal, planned outcome, not as a drama in money. They value a +3 R trade not for the sum, but for the excellence of the ratio. R makes you a risk manager rather than a gain hunter, and that's precisely what distinguishes traders who last.
Planned R versus realized R
As with the risk/reward ratio, you must distinguish the R you aimed for from the R you actually got. You can plan a trade at +3 R and cut it at +1 R out of fear, or move your stop and turn a planned -1 R into -2 R. The realized R, computed on your actually closed trades, is the only honest measure of your performance.
It's often a revelation: many traders discover their average realized R is far lower than they thought, because they cut their gains too early and sometimes let their losses run. Measuring your real R, rather than your theoretical R, shows you the gap between your intentions and your execution, and it's in that gap that your biggest possible progress hides.
The distribution of your R
Beyond your average R, the distribution of your R (how your trades spread across -1 R, +2 R, +3 R, etc.) tells a precious story about your trading. Some traders have a distribution concentrated around small R, others depend on rare big R for all their performance. Knowing your distribution tells you where your edge really comes from: a steady flow of small gains, or a few exceptional trades carrying everything else.
This information is crucial, because it has direct implications for your psychology and management. If your performance depends on rare big R, you absolutely must let your winners run and accept many small losses, which is grueling. If it comes from steady small R, you can cut earlier without destroying your edge. Looking at the distribution of your R, not just their average, lets you understand your system's deep nature and adjust your behavior to what really makes you win.
R and size management
Thinking in R elegantly decouples two decisions beginners confuse: the trade's quality and the position size. R measures quality (the gain/risk ratio) independent of size, and size is decided separately, based on your risk percentage and your capital. This separation clarifies your thinking: you first judge whether a trade is good in R, then decide how much you engage in money.
This clarity has an important practical consequence: it lets you grow your performance without changing how you trade. Your edge, measured in R, stays the same whatever your size; it's by gradually increasing what your R is worth in money (as your capital and confidence grow) that you grow your gains. R gives you a stable language to talk about your trading's quality, independent of amounts, which is especially useful when your capital evolves or when you move from one account to another.
R as a universal language between traders
R has an often-overlooked advantage: it's a universal language that lets you compare traders and systems independent of their capital. Saying 'I made +200 this week' says nothing about your skill without knowing your capital and size; saying 'I made +4 R this week' expresses your performance in units of risk, comparable with any other trader, whatever their account. That's why serious traders often communicate in R rather than in amounts.
Adopting R as a reference unit also changes your relationship to your own results. You stop judging your weeks on amounts, which depend on your size and flatter or depress depending on the period, and judge them on R, which reflect the pure quality of your trading. This shift detaches you from the emotion tied to money and focuses you on what you really control: the quality of your decisions, measured in units of risk. R isn't just a measurement tool, it's a healthier way to think about all your trading.
A worked example over a month of trading
Take a trader who took twenty trades over a month, each with a different initial risk in money but all converted to their respective R. Twelve trades lost at -1 R, six winning trades returned +1.5 R on average, and two exceptional trades hit +4 R each. The sum gives: -12 R + 9 R + 8 R, or +5 R net for the month, for an expectancy of +0.25 R per trade.
That number, +0.25 R per trade, is immediately comparable to the following month, whether the trader traded a 5,000 or a 50,000 account, and whether their unit risk was 20 or 200. That's exactly what raw P&L never lets you do: compare the quality of two periods independent of the size played. Without R, that same trader would only see an amount in money, impossible to interpret without knowing the size context of each trade.
The traps of computing R
Computing an R seems simple in theory, but some practical cases complicate it. A trade with no clearly defined stop has no measurable R: that's already, in itself, a warning sign, since the absence of defined risk is one of a trader's worst reflexes. A trade closed at the exact entry point, with no gain or loss, makes 0 R, a neutral result not to be confused with a loss.
Partial exits also complicate the calculation: if you exit half your position at +2 R and the other half at +4 R, your effective R for the trade is the weighted average of the two, or +3 R on the total position. A good tracking tool should handle these fractional exits automatically, because computing them by hand, trade after trade, is a source of errors that quickly discourages rigorous R journaling.
High win rate or high R: two paths to the same edge
Two systems can have the same positive expectancy through radically different paths. One might win 70% of its trades with a modest average R of +0.5 on winners and -1 on losers, producing a steady, reassuring expectancy. The other might win only 30% of its trades, but with winners averaging +5 R, producing an equally positive expectancy despite a far lower win rate.
These two profiles demand very different psychology. The first trader lives through a majority of winning days but must handle rare big losses; the second absorbs a majority of small losses and must have the discipline to let the rare winners that carry all their performance run. Knowing your own system's profile, via the distribution of your R, tells you what psychology you need to cultivate to execute it without sabotaging it: accepting many losses isn't a problem if your edge structurally depends on it.
| Profile | Win rate | Average winning R | Psychological demand |
|---|---|---|---|
| High frequency | ~70% | +0.5 R | Handling rare big losses |
| High R | ~30% | +5 R | Letting winners run, absorbing frequent losses |
How Tradoshi computes your R
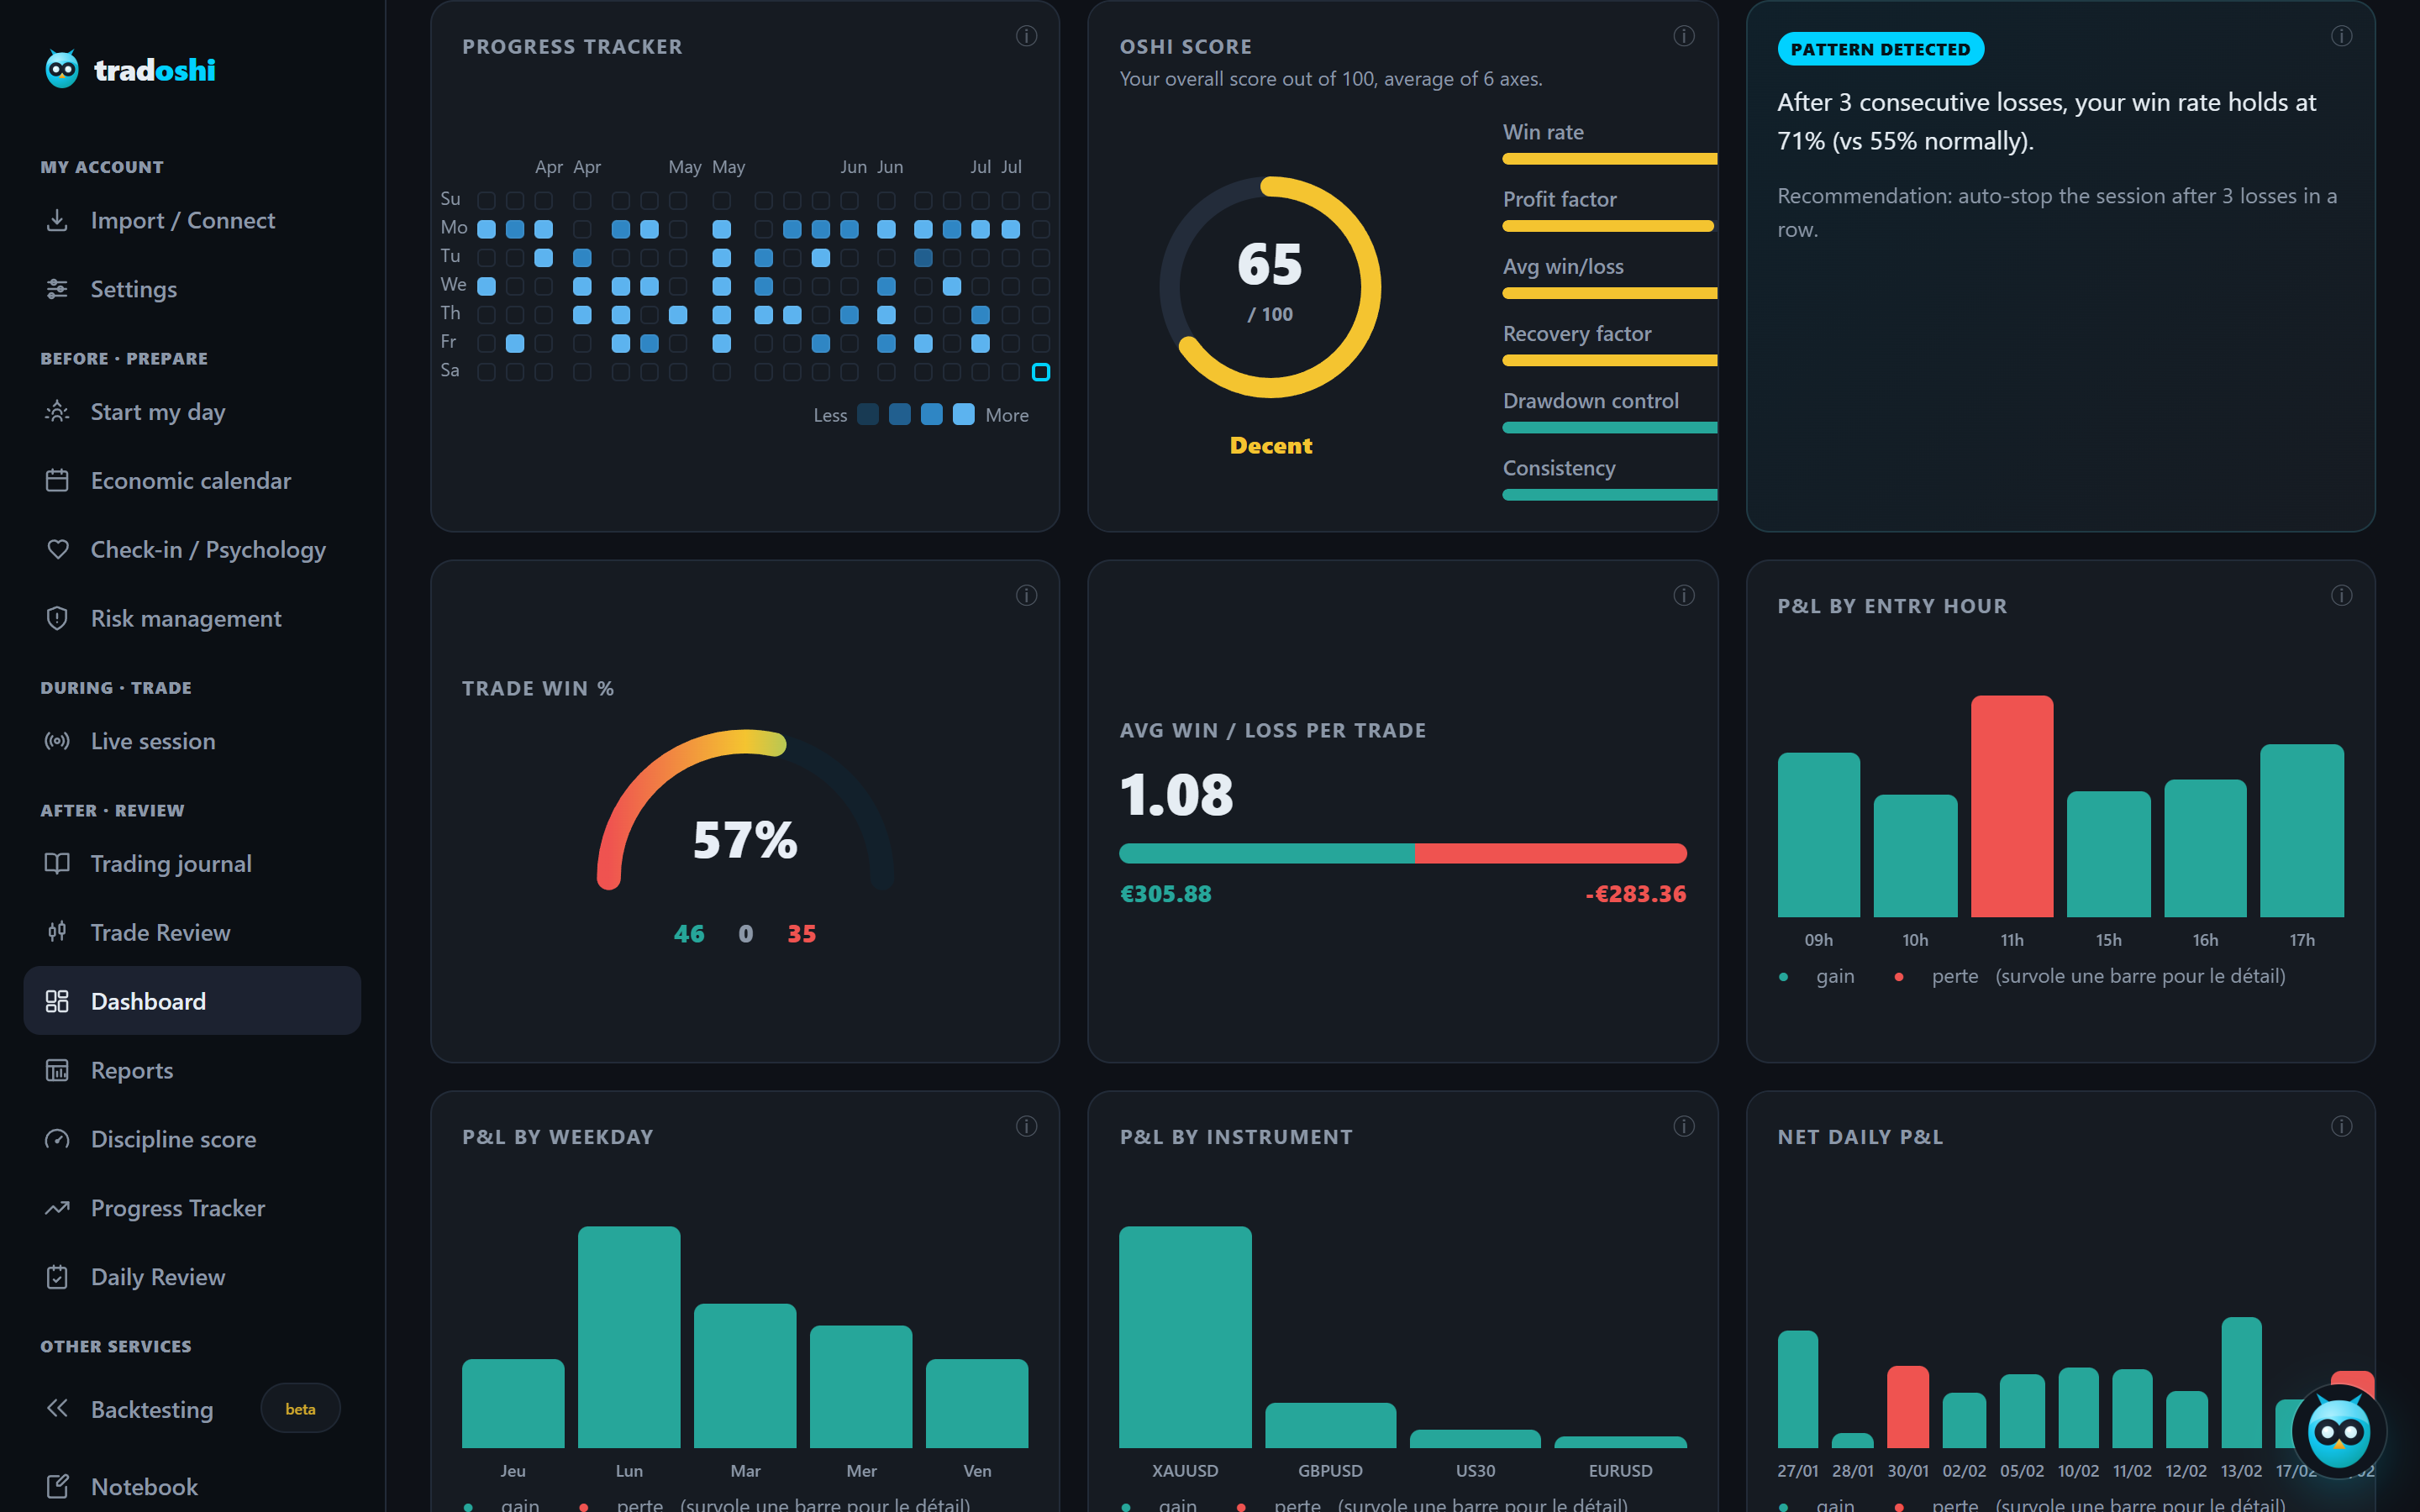
Tradoshi reads your stop loss from your orders and automatically computes each trade's R-multiple, without you entering anything. You see your real R, your expectancy in R, and the quality of your trades stripped of the size effect.
- Automatic R-multiple: your initial risk is read from your stop, your R computed on every closed trade.
- Expectancy in R: your average gain per trade in units of risk, the measure of your edge.
- Realized R: you see whether your exits keep their promises or degrade your planned R.
- Comparable trades: all your trades are put on the same scale, whatever their size.
Frequently asked questions
What is the R-multiple in trading?
It's a way of measuring your trades in multiples of your initial risk. 1 R is the distance between your entry and your stop, expressed in money. A trade that wins twice your risk is +2 R, a stopped-out trade is -1 R. Counting in R makes all your trades comparable on one scale, whatever their size.
Why measure trades in R rather than money?
Because money mixes the trade's quality and its size: a big gain can come from an excellent trade or a big position on a mediocre one. R separates these dimensions by erasing size and keeping only the gain/risk ratio. It makes trades of different sizes comparable and shifts your focus to risk, the right way to think.
How do I compute a trade's R-multiple?
1 R = the distance between your entry and your stop (your initial risk). The R-multiple = the trade's gain (or loss) divided by that initial risk. If you risked 2 and the trade returned 6, your R-multiple is +3 R. A stopped-out trade is -1 R. A tool that reads your stop can compute it automatically on every trade.
What is expectancy in R?
It's your average gain per trade expressed in units of risk: add up your R over a set of trades and divide by the number of trades. An expectancy of +0.3 R means each trade returns on average 30% of your risk. It's a very useful number because it measures your edge per trade independent of the size you take.
Does R change how I think about trading?
Yes, deeply. Reasoning in money activates fear and greed by capturing your attention on money. Reasoning in R puts your attention on risk, the right way to think. A trader who thinks in R accepts a -1 R loss as normal and planned, and values a +3 R for the excellence of the ratio, not the sum. R makes you a risk manager.
Why does my real R differ from my planned R?
Because you sometimes cut your gains too early (turning a planned +3 R into +1 R) or let your losses run (turning a -1 R into -2 R). The realized R, computed on your actually closed trades, is the only honest measure. Many traders discover their real R is far lower than they thought, and it's in that gap that their biggest possible progress hides.
How do I compute R for a trade with no clear stop or a partial exit?
A trade with no defined stop has no measurable R, which is already a warning sign in itself. For a partial exit (say half at +2 R, the other half at +4 R), your effective R is the weighted average of the two, or +3 R on the total position. A good tracking tool handles these cases automatically, since computing them by hand is a frequent source of errors.
Is a high win rate or a high R system better?
Both can produce the same positive expectancy through different paths: a 70%-win system with modest winners, or a 30%-win system with winners averaging +5 R. The first requires handling rare big losses, the second requires the discipline to let the rare winners that carry all the performance run.