 By Benjamin Roure L'Hermitte
Win rate is the share of your trades that are winners; profit factor is your total gains divided by your total losses. The first says how often you win, the second whether you make money, and they can contradict each other: a trader can win 80% of their trades and lose money as soon as their average loss exceeds four times their average gain, another can win only 35% and be profitable if their average gain is more than twice their average loss. So the win rate means almost nothing on its own, and the profit factor tells you what really matters.
- The win rate alone says nothing: you can win often and lose money.
- The profit factor measures real profitability: total gains ÷ total losses.
- A profit factor > 1 = winning system, whatever the win rate.
- The win rate flatters the ego, the profit factor tells the account's truth.
Ask a trader how they're doing, and they'll often talk about their win rate: 'I win 70% of my trades'. It sounds good, it flatters, and it's almost worthless. Because the win rate says nothing about the size of your gains or your losses. Yet that's exactly where your profitability is decided. A trader who wins often but small and loses rarely but big is a losing trader, despite a nice win rate.
The profit factor corrects this blind spot. It relates the total of what you won to the total of what you lost, and tells you in one number whether your trading is profitable. This guide explains why the win rate is misleading, how the profit factor measures real profitability, how the two combine, what a profit factor measured on few trades is worth, and why you should always read them together.
Why the win rate is misleading
The win rate measures only one thing: how often you're right. But in trading, being right often doesn't mean making money, because what matters isn't the frequency of your gains, it's their size relative to your losses. A 90% win rate loses money as soon as the average loss exceeds nine times the average gain, and a 30% win rate makes money as soon as the average gain exceeds 2.4 times the average loss.
It's the classic trap of the trader who 'cuts winners and lets losers run': they win small sums often and lose big sums rarely. Their win rate is superb, their account is in the red. The tendency has been measured, at least among stock investors: across 10,000 accounts at a large US discount broker followed from 1987 to 1993, Odean's 1998 study in the Journal of Finance shows that investors realize their gains more readily than their losses, 14.8% of possible gains realized against 9.8% of losses. Those are individual stock investors, not intraday currency or futures traders: it's up to you to check in your journal whether you do the same. The win rate, by isolating frequency from size, hides exactly the information that decides your profitability. That's why it flatters so much: it gives you the illusion of doing well when the account says the opposite.
What the profit factor measures
The profit factor is far more honest, because it incorporates both frequency and size. Its formula is simple: it's the total of all your gains divided by the total of all your losses. That is the definition in MetaTrader 5's help on the testing report, the ratio of gross profit to gross loss, and on TradingView's profit factor page, the absolute value of all winning trades divided by that of all losing trades, on closed positions only. If you won 3,000 total and lost 2,000 total, your profit factor is 1.5. That single number tells you the essential: above 1, you make money; below 1, you lose it; at 1, you're at breakeven.
| Profit factor | Meaning |
|---|---|
| Below 1 | Losing system: you lose money |
| Equal to 1 | Breakeven: you neither win nor lose |
| Above 1 | Winning system: your gross profit exceeds your gross loss |
The benchmarks you read everywhere, 1.5 for a good system and 2 for an excellent one, are a custom, not a statistical threshold: neither MetaTrader 5's help nor TradingView's sets any, and the arithmetic below shows that a system whose true profit factor is 1.5 can show anything between 1 and 2.2 over 100 trades.
Unlike the win rate, the profit factor can't hide a negative result from you. It captures in a single number the ratio between what you win and what you lose, accounting for everything. That's why it's one of the best single indicators of a system's health: if you had to keep just one number, it would be this one rather than the win rate.
How win rate and profit factor combine
Win rate and profit factor aren't opposed, they complement each other: the second depends on the first and on the gain/loss ratio, and the relation is exact. If your average loss is 1 and your average gain is R times that loss, profit factor = (win rate × R) ÷ (1 − win rate), before fees. A system can reach a good profit factor by two opposite paths. The first: a high win rate with a modest ratio (you win often, but a little). The second: a low win rate with a big ratio (you win rarely, but a lot). Both can produce the same profit factor.
| Profile | Win rate | Gain/loss ratio | Profit factor | Expectancy per trade |
|---|---|---|---|---|
| Scalper | 70% | 0.7 | ≈ 1.6 | +0.19 R |
| Swing | 40% | 2.5 | ≈ 1.7 | +0.40 R |
| Trend follower | 30% | 4.0 | ≈ 1.7 | +0.50 R |
| Typical loser | 75% | 0.3 | ≈ 0.9 | −0.025 R |
The table illustrates a liberating truth: there's no universal good win rate. A 70% scalper and a 30% trend follower can be equally profitable. What matters is the coherence between your win rate and your ratio, measured by the profit factor. The last column is expectancy per trade in units of risk, win rate × R − (1 − win rate), and it follows from the profit factor: expectancy = (profit factor − 1) × (1 − win rate). Notice the last row: a superb 75% win rate with a catastrophic ratio gives a losing system.
The breakeven threshold is a one-line calculation too: minimum win rate = 1 ÷ (1 + R). At a 1:2 ratio it sits at 33.3%; at 1:1, at 50%; at 1:0.5, at 66.7%, before fees. Below that threshold the profit factor drops under 1 whatever care you put into your entries, and above it, it rises faster the larger the ratio.
Why you should always read them together
Neither of these two numbers suffices alone, and that's the central message. The win rate alone hides the size of your gains and losses. The profit factor alone doesn't tell you how you win (often and small, or rarely and big), useful information for understanding your style and psychological comfort. A low win rate, even profitable, demands a mental sturdiness not everyone has: absorbing many small losses for rare big gains is grueling.
The win rate tells you how often you're right. The profit factor tells you if being right pays. Only the second pays your bills.
So the good practice is to always look at both together, keeping in mind that the profit factor is the judge of profitability and the win rate a mere descriptor of your style. Never judge your trading on your win rate alone: it's the best way to think yourself good while losing money, or think yourself bad while being profitable.
The win rate and the trader's psychology
Beyond the math, a system's profile of gains and losses weighs on your ability to follow it, and that profile can be computed too. A low-win-rate but good-ratio system is mathematically excellent, but it forces you to absorb long losing streaks punctuated by rare big gains: at a 30% hit rate, five consecutive trades have about a one-in-six chance of all being losers (0.7 to the power of 5), assuming independent trades. If you can't stand those streaks, you will end up deviating from the plan, and the system will be worth nothing.
Conversely, a high-win-rate system is reassuring, but it hides a danger: losses, being rarer, weigh all the more in the total, and delaying the exit of a losing trade to preserve a nice hit rate is exactly the behavior Odean's study cited above measures among stock investors. So the choice of a style isn't made on math alone, but also on your ability to follow the profile of gains and losses it implies. The best system on paper is worthless if you don't hold to it.
The profit factor and sample size
A profit factor only has value if computed on a sufficient sample, and that uncertainty can be computed. With the Wilson confidence interval presented in the NIST statistics handbook, the US standards institute, a 50% win rate measured over 30 trades lies, at 95%, between roughly 33% and 67%; over 100 trades, between 40% and 60%; it takes 400 trades to narrow it to between 45% and 55%. Carried into the profit factor formula with a gain/loss ratio of 1.5 assumed stable, that gives a profit factor anywhere between 0.7 and 3 over 30 trades, between 1 and 2.2 over 100 trades, and between 1.2 and 1.8 over 400 trades, for a system whose true profit factor is 1.5.
A beginner showing a profit factor of 3 on their first fifteen trades has therefore proved nothing: with that same 1.5 ratio, the figure corresponds to ten winning trades out of fifteen, and the 95% interval of that rate runs from 42% to 85%, which is a profit factor between 1.1 and 8. The benchmark in the Van Tharp Institute's trading concepts, thirty trades at minimum for a first idea and rather one to two hundred for a clear picture, is a custom consistent with that arithmetic, not a statistical threshold. Beware too of extremely high profit factors, even on a good sample: they can come from a few exceptional trades whose repetition isn't guaranteed. The indicator's stability matters as much as its value. That is exactly what separates a trader from a gambler, and whether day trading is gambling comes down to this point.
Beyond the pair: expectancy
Win rate and profit factor are useful, but there's an indicator that synthesizes them and goes further: expectancy. In the Van Tharp Institute's trading concepts, it is the mean of your trade results expressed as multiples of the initial risk; MetaTrader 5's help shows it in currency under the name expected payoff, the average return of one deal. Where the profit factor gives you a ratio, expectancy gives you an amount: on the 3,000 won and 2,000 lost in the example, made over 20 trades, it comes to 50 per trade, and it lets you project your performance and reason in units of risk.
The ideal is to look at these three indicators together: win rate describes your style, profit factor confirms your profitability, and expectancy quantifies your edge per trade. None suffices alone, but together they give you a complete, honest picture of your trading. The trap to avoid is fixating on a single number, especially the isolated win rate, which is the most flattering and most misleading. A trader who reads these indicators as a coherent system understands their trading far better than one who reassures themselves with a nice hit rate. The full list, drawdown and average R included, is in the trading statistics that matter.
Win rate by trading style
The 'normal' win rate varies by style, and it is arithmetic that imposes it, not an observed norm. A scalping strategy aiming for small moves with a tight stop and a close target works with a gain/loss ratio close to 1: to be profitable it must win more than one trade in two, so a profitable scalper has, by construction, a win rate above 50%. A swing trader who lets gains run over several days while cutting losses fast can aim for a ratio of 2 or 3: their threshold drops to 33.3% or 25%, and they can lose two trades in three and stay profitable. A trend follower aiming for a ratio of 4 needs only a 20% hit rate to break even, before fees, and a handful of exceptional trades pays for a whole string of small losses.
These thresholds are floors before fees, not targets: your own win rate depends on your exit rules, your market and your risk management, and there's no shame in a 35% win rate if your profit factor is solid. What should alert you isn't a 'low' win rate in the absolute, it's a win rate that doesn't match your real ratio. If you describe yourself as a trend follower but your win rate looks like a scalper's, chances are you're cutting your winners too early, quietly betraying your own plan without realizing it. The only benchmark that really applies to you is your own breakeven threshold, and the win rate calculator works it out from your average win and your average loss.
How to concretely improve your profit factor
The profit factor improves in two complementary ways: increasing the total of your gains, or reducing the total of your losses. On the loss side, the most direct lever is cutting trades that go wrong faster, before a small planned loss turns into a large unplanned one. A mediocre profit factor sometimes owes less to the analysis than to a few losses allowed to slip well beyond the initial stop: they weigh heavily on the total losses regardless of how often they happen, and that is the very mechanism of the disposition effect Odean measured.
On the gain side, the most effective lever is often letting your winning trades run longer rather than hunting for more trades. Exiting a bit later on your best setups, when conditions allow, increases your total gains without changing your win rate or your trading frequency. Combining both levers, losses cut shorter and winners run a bit longer, has a multiplying effect on the profit factor, far more powerful than trying to add trades to compensate for a bad ratio.
A third, less obvious lever is filtering out your weakest setups entirely. If you segment your trades by configuration, you may find that one or two setups drag your overall profit factor down while the rest perform well above 1.5. Removing those weak setups from your rotation, rather than trying to trade them better, can lift your blended profit factor more than any tweak to stop placement or trade management. This is where a journal earns its keep: without segmented data, a dragging setup hides inside your averages, quietly eating into a profit factor that would otherwise look considerably healthier.
How Tradoshi computes both
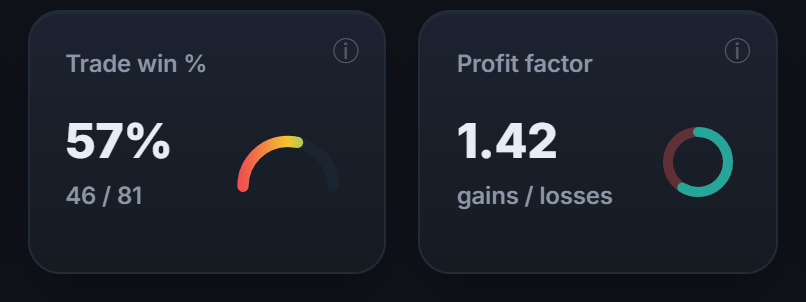
Tradoshi automatically computes your win rate and profit factor on your real trades, and displays them side by side so you judge your profitability on what matters, not on the number that flatters.
- Real win rate: your percentage of winning trades computed on your real trades.
- Profit factor: your total gains related to your total losses, your profitability judge.
- Gain/loss ratio: your average gain size versus your average loss size, to complete the picture.
- Cross reading: your numbers are shown together to never judge on the win rate alone.
Profit factor, R/R, win rate: three numbers, one question
Profit factor is gross profit divided by gross loss. Above 1 the strategy wins, below it loses. That is the whole trading definition, and MetaTrader 5's testing report and TradingView's performance summary apply that same one: the software changes the display, not the formula. A profit factor calculator performs that one division, and knowing it by hand means never depending on a tool to read your own statement. Whether you compute your profit factor trading live or on a backtest, it reads the same way.
Risk-reward and win rate are the pair that explains the profit factor. A low win rate is compensated by a high ratio, and the reverse holds. The R:R ratio is one half of that pair, the win rate the other. Neither is judged alone, and that is the commonest beginner mistake.
A few other measures sit nearby without measuring the same thing. The reward to volatility ratio grades consistency rather than profitability, which makes it useful when comparing two strategies that earn the same. The risk-free rate asks a different question again: what a riskless placement would have paid over the same period, which is the floor any strategy should clear. And a trading return calculator simply expresses the result as a percentage of the capital that was actually at work.
Frequently asked questions
What is the win rate in trading?
It's the percentage of your trades that are winners, what MetaTrader 5's help calls profit trades as a percentage of the total. It says almost nothing alone: it measures how often you're right, not whether you make money. You can win 80% of your trades and lose money as soon as the average loss exceeds four times the average gain.
What is the profit factor?
It's the total of all your gains divided by the total of all your losses. If you won 3,000 and lost 2,000, your profit factor is 1.5. Above 1, your system is a winner; below, a loser; at 1, breakeven. Unlike the win rate, it incorporates both frequency AND size, so it can't hide a negative result from you.
Which is the better indicator, win rate or profit factor?
The profit factor for judging profitability, no hesitation: it tells you whether you make money. The win rate is a mere descriptor of your style (do you win often and small, or rarely and big?). If you had to keep one number, it would be the profit factor. But ideally, always read both together.
Does a good win rate guarantee profitability?
No, absolutely not. A 75% win rate with a bad gain/loss ratio (rare huge losses) gives a losing system. It's the classic trap of the trader who cuts winners and lets losers run: they win small sums often and lose big sums rarely. Their win rate flatters, their account is in the red.
What win rate should I target?
There's no universal good win rate, only a breakeven threshold, 1 ÷ (1 + gain/loss ratio): 50% at a ratio of 1, 33.3% at 2, 20% at 4, before fees. A scalper can be profitable at 70%, a trend follower at 30%, if they have the matching ratio. What matters is that your win rate clears your threshold with some margin, and that is what the profit factor measures in a single number.
What's a good profit factor?
Above 1, your system is profitable: that is the only threshold MetaTrader 5's help and TradingView's page set. The customary benchmarks, 1.5 for a good system and 2 for an excellent one, have no statistical value: a system whose true profit factor is 1.5 can show anything between 0.7 and 3 over 30 trades and between 1 and 2.2 over 100 trades. A good profit factor is first of all one measured on enough trades to be credible.
Should a scalper aim for the same win rate as a swing trader?
No. Each style has its own breakeven threshold, set by its gain/loss ratio: a scalper working at a ratio of 1 must clear a 50% hit rate, a swing trader at a ratio of 2 breaks even at 33.3%, a trend follower at a ratio of 4 from 20%, before fees. These are floors, not norms: what matters is the coherence between your win rate and your real ratio.
How many trades does it take for a profit factor to be reliable?
There is no statistical threshold, only arithmetic. With the Wilson interval from the NIST handbook, a 50% win rate measured over 30 trades lies, at 95%, between 33% and 67%; over 100 trades, between 40% and 60%; over 400 trades, between 45% and 55%. With a gain/loss ratio of 1.5, that makes a profit factor between 0.7 and 3 over 30 trades, between 1 and 2.2 over 100 and between 1.2 and 1.8 over 400. The Van Tharp Institute's benchmark, thirty trades at minimum and rather one to two hundred, is a custom consistent with that arithmetic.
How do I concretely improve my profit factor?
By combining two levers: cutting losses that slip beyond your initial stop faster, and letting your best winning trades run a bit longer when conditions allow. These two adjustments, shorter losses and slightly longer winners, have a multiplying effect on the profit factor, more powerful than adding trades to compensate for a bad ratio.