The RSI, when you actually understand it, is a genuinely useful tool. Misread, it's the fastest way to short a stock that keeps climbing for three more days while you sit there in a losing position. Let's break down what it really measures, and more importantly, what it doesn't.
- The RSI measures the speed and size of recent price moves, not where price is headed next.
- The 70 and 30 zones are not automatic buy or sell triggers, they just flag an acceleration in momentum.
- Divergences are the most reliable use of this indicator, but they take patience and context to trade well.
- No indicator replaces a plan and risk management, understanding the RSI alone doesn't give you an edge.
What the RSI actually is
The RSI, or Relative Strength Index, was built by J. Welles Wilder back in the 1970s. The core idea is simple. It measures whether recent gains have been stronger than recent losses, over a set lookback period. The result shows up as a line oscillating between 0 and 100, sitting below your price chart.
When the RSI climbs, it means green candles have been dominating lately, both in number and in size. When it drops, red candles took over. Nothing mystical about it. It's a momentum calculation, not a crystal ball. A lot of new traders forget that and treat the RSI like a binary switch: above 70, sell, below 30, buy. Spoiler alert, it doesn't work that way, and we'll get into why.
The RSI formula (without drowning you in math)
You don't need to calculate the RSI by hand, your charting software does it for you. But understanding the logic behind it changes how you read it.
The calculation happens in two steps. First you get the Relative Strength (RS), which is simply the average gain over the period divided by the average loss over that same period. Then that value gets converted into the 0-100 scale using this formula: RSI equals 100 minus (100 divided by (1 plus RS)).
In practice: if over the last 14 candles, gains averaged twice the size of losses, RS equals 2, and the RSI sits around 67. If losses dominate heavily, the RSI drops toward 20 or lower. That's the whole mystery solved. It's a relative strength comparison, nothing more, nothing less.
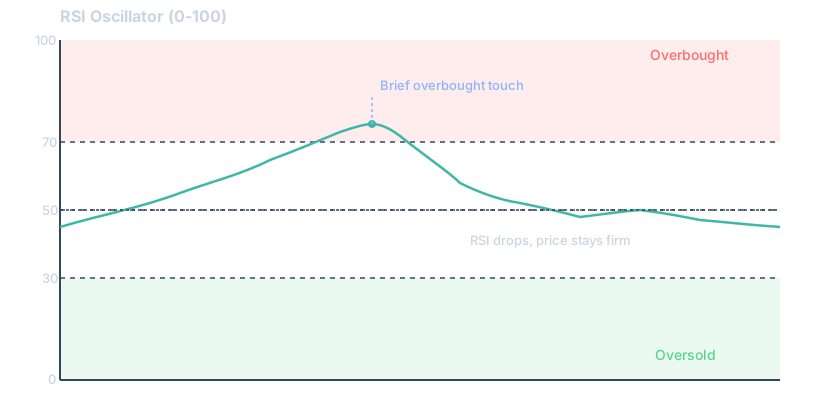
Overbought, oversold: what these zones really tell you
Here's trap number one. An RSI above 70 means the market is moving up fast, not that it's about to fall. In a solid uptrend, an asset can sit above 70 for days, sometimes weeks. You short it thinking you're being clever, and you get run over by a trend that just keeps going.
Same thing works in reverse. An RSI under 30 in a real downtrend can stay glued to the floor for a long stretch. The market has zero obligation to bounce just because an indicator prints a low number.
What these zones actually flag is excess speed. The move has been fast and one-directional. That can precede a pause, a consolidation, or yes, sometimes a reversal. But it can also just precede... more of the same move. The RSI gives you context, not an execution order. In a ranging market, these zones work far better than in a strongly trending one. That's exactly where reading market structure becomes non-negotiable, and why a solid setup usually pairs the RSI with other tools, like moving averages to place your entries and exits within the broader trend.
RSI divergences: the most powerful use, and the most misunderstood
If you keep only one thing from this whole article, make it this: the divergence. That's when price and the indicator start telling two different stories.
A classic bearish divergence happens when price makes a higher high than the previous one, but the RSI makes a lower high. Translation: price is still climbing, but the force behind the move is fading. Fewer buyers, less conviction. It doesn't mean a crash is coming right now, but it's a serious warning sign worth watching.
Bullish divergence works the opposite way: price makes a lower low, but the RSI makes a higher low. Sellers are losing steam even though price keeps drifting down. These setups often precede solid bounces, especially when they show up after a long, tired trend.
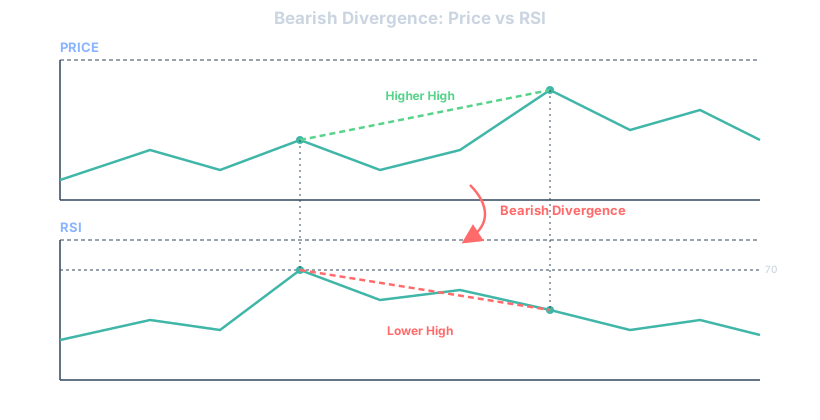
Careful though. Divergences alone aren't entry signals. They tell you a move is running out of gas, not exactly when the tank goes empty. A lot of traders jump in too early on a divergence that keeps grinding another ten candles before it actually turns. That's where a trading plan with precise entry rules makes the difference between profiting from a divergence and getting trapped by one.
The classic mistakes traders make with the RSI
I've seen, and made, every single one of these. Here they are, no filter.
- Treating every touch of 70 or 30 as an automatic signal, without checking the surrounding trend context first.
- Forgetting the RSI can stay extreme for a long time in a strong trend, and eating several counter-trend stops in a row.
- Hunting for divergences everywhere, even where none really exist, because you desperately want a signal that confirms what you already believe.
- Using the RSI in isolation, with no support or resistance, no market structure, no other filter at all.
- Tweaking the RSI period over and over until you find a setting that would have worked on the last five trades, which tells you nothing about the future.
That third point deserves a second look. Desperately wanting to see a divergence because you're already in a position and looking for a reason to stay in it, that's exactly the mechanism behind the confirmation bias that keeps you holding a losing trade. The RSI only becomes dangerous when you bend it toward what you want to see instead of what it's actually showing you.
Combining the RSI with other tools, the smart way
The RSI on its own is still an incomplete tool. It knows nothing about price levels, nothing about volume, nothing about structure. It just compares the speed of gains to the speed of losses over a rolling window.
Most traders who use it well pair it with at least one trend read, often moving averages or a structure of higher highs and lows, sometimes with key price zones added on top. A bearish RSI divergence that shows up right at a major resistance zone carries far more weight than an isolated one floating in the middle of nowhere.
Another common combo: using the RSI as a timing filter on a trend-following strategy. You wait for a clear uptrend, then use an RSI pullback toward 40-50, not 30, as your entry zone, instead of waiting for an extreme oversold reading that might never show up in a strong trend anyway.
Setting the RSI period for your trading style
The default period is 14, on most platforms. That's a decent starting point, not a rule carved in stone. Shorten the period and the RSI gets twitchier, more reactive, with more false signals. Stretch it out and it smooths and slows down, at the risk of reacting too late.
| Trading style | Common RSI period | Behavior |
|---|---|---|
| Scalping | 5 to 9 | Very reactive, lots of signals, lots of noise too |
| Day trading | 9 to 14 | Good balance between reactivity and reliability |
| Swing trading | 14 to 21 | Smoother, filters out micro-moves better |
| Position trading | 21 and up | Rare signals, but usually more meaningful |
There's no universal magic setting. What matters is testing your configuration on enough history before you trade it live, instead of guessing. That's exactly the kind of question you settle by backtesting a strategy without lying to yourself about the results you got.
How Tradoshi helps you
The RSI can help you read a market's context. But the question that actually matters, in the end, is this: are YOUR trades based on the RSI actually profitable, over time, with your risk management? Not the indicator in theory. Your trades, in reality.
That's exactly what Tradoshi lets you check. By logging every trade with the setup you used, you can isolate every trade taken on an RSI divergence, or on a 40-50 pullback, and look at their real numbers: win rate, risk-reward ratio, expectancy. Not your gut feeling after three wins in a row, but figures across a large enough sample.
Tradoshi's discipline score also plays a quiet but useful role here. It flags whether you're actually following your RSI entry rules or improvising the moment the market speeds up. And the risk management module makes sure a good-looking RSI signal never turns into an oversized position just because you got a little too confident. The indicator gives you the idea. The journal gives you the proof.
Before you take your next RSI trade
The RSI is a strong context tool. A weak prediction tool. The difference between the two comes down to how you use it: as one filter among several, or as a magic button that says buy here, sell there. Traders who actually get better with this indicator are the ones who accept its limits and check, with real numbers, what genuinely works for them, rather than trusting a textbook rule blindly. If you're serious about that verification step, it starts with keeping a trading journal that's actually useful rather than a spreadsheet you abandon after a week.
Frequently asked questions
What's a good RSI value to buy or sell?
There isn't one universal number. Below 30 suggests a stretched downside move, above 70 an extended upside move, but both can persist much longer than expected in a strong trend. Treat these levels as context, not triggers.
Why does the RSI stay above 70 for so long sometimes?
Because strong trends keep producing bigger gains than losses for extended periods. The RSI reflects that dominance, it doesn't cap it. Staying overbought is often a sign of strength, not weakness.
Is a bullish divergence a buy signal by itself?
No. It's a warning that selling pressure is fading, which often precedes a bounce, but timing still needs confirmation from price action or structure before you enter.
What RSI period should beginners use?
Start with the default 14. It's a reasonable balance between reactivity and reliability, and it lets you learn how the indicator behaves before you start tweaking settings you don't fully understand yet.
Can the RSI be used alone as a full strategy?
Technically yes, practically it's risky. Without market structure, trend context, or risk management around it, RSI signals alone tend to generate too many false entries in trending markets.
Does the RSI work the same way on crypto as on stocks?
The math is identical, but crypto's volatility means the RSI swings faster and hits extremes more often. Many crypto traders adjust their zones or shorten the period slightly to compensate.
What's the difference between RSI and momentum indicators like MACD?
Both measure momentum, but the RSI is bounded between 0 and 100 and focuses on the ratio of gains to losses, while MACD tracks the relationship between two moving averages and has no fixed range.
How do I know if a divergence is reliable or just noise?
Look for divergences that form after an extended, mature trend, ideally near a key support or resistance zone. Divergences appearing early in a fresh trend are far less trustworthy.
Should I change my RSI settings for every asset I trade?
Not randomly. It's fine to adjust the period based on your holding time frame, but changing settings asset by asset just to fit recent price action is a form of overfitting that rarely holds up going forward.
Can the RSI help with position sizing?
Not directly. The RSI tells you about momentum, not about how much capital to risk. Position sizing should come from your risk management rules, independent of what any single indicator is showing.