You've hit a plateau. See exactly what to fix.
Some weeks you're green, others you give it all back, and you can't tell what changed. Tradoshi puts your best and worst days side by side, quantifies every recurring mistake and tracks your consistency week after week. You already have the skills: what you're missing is the data showing where your results leak.
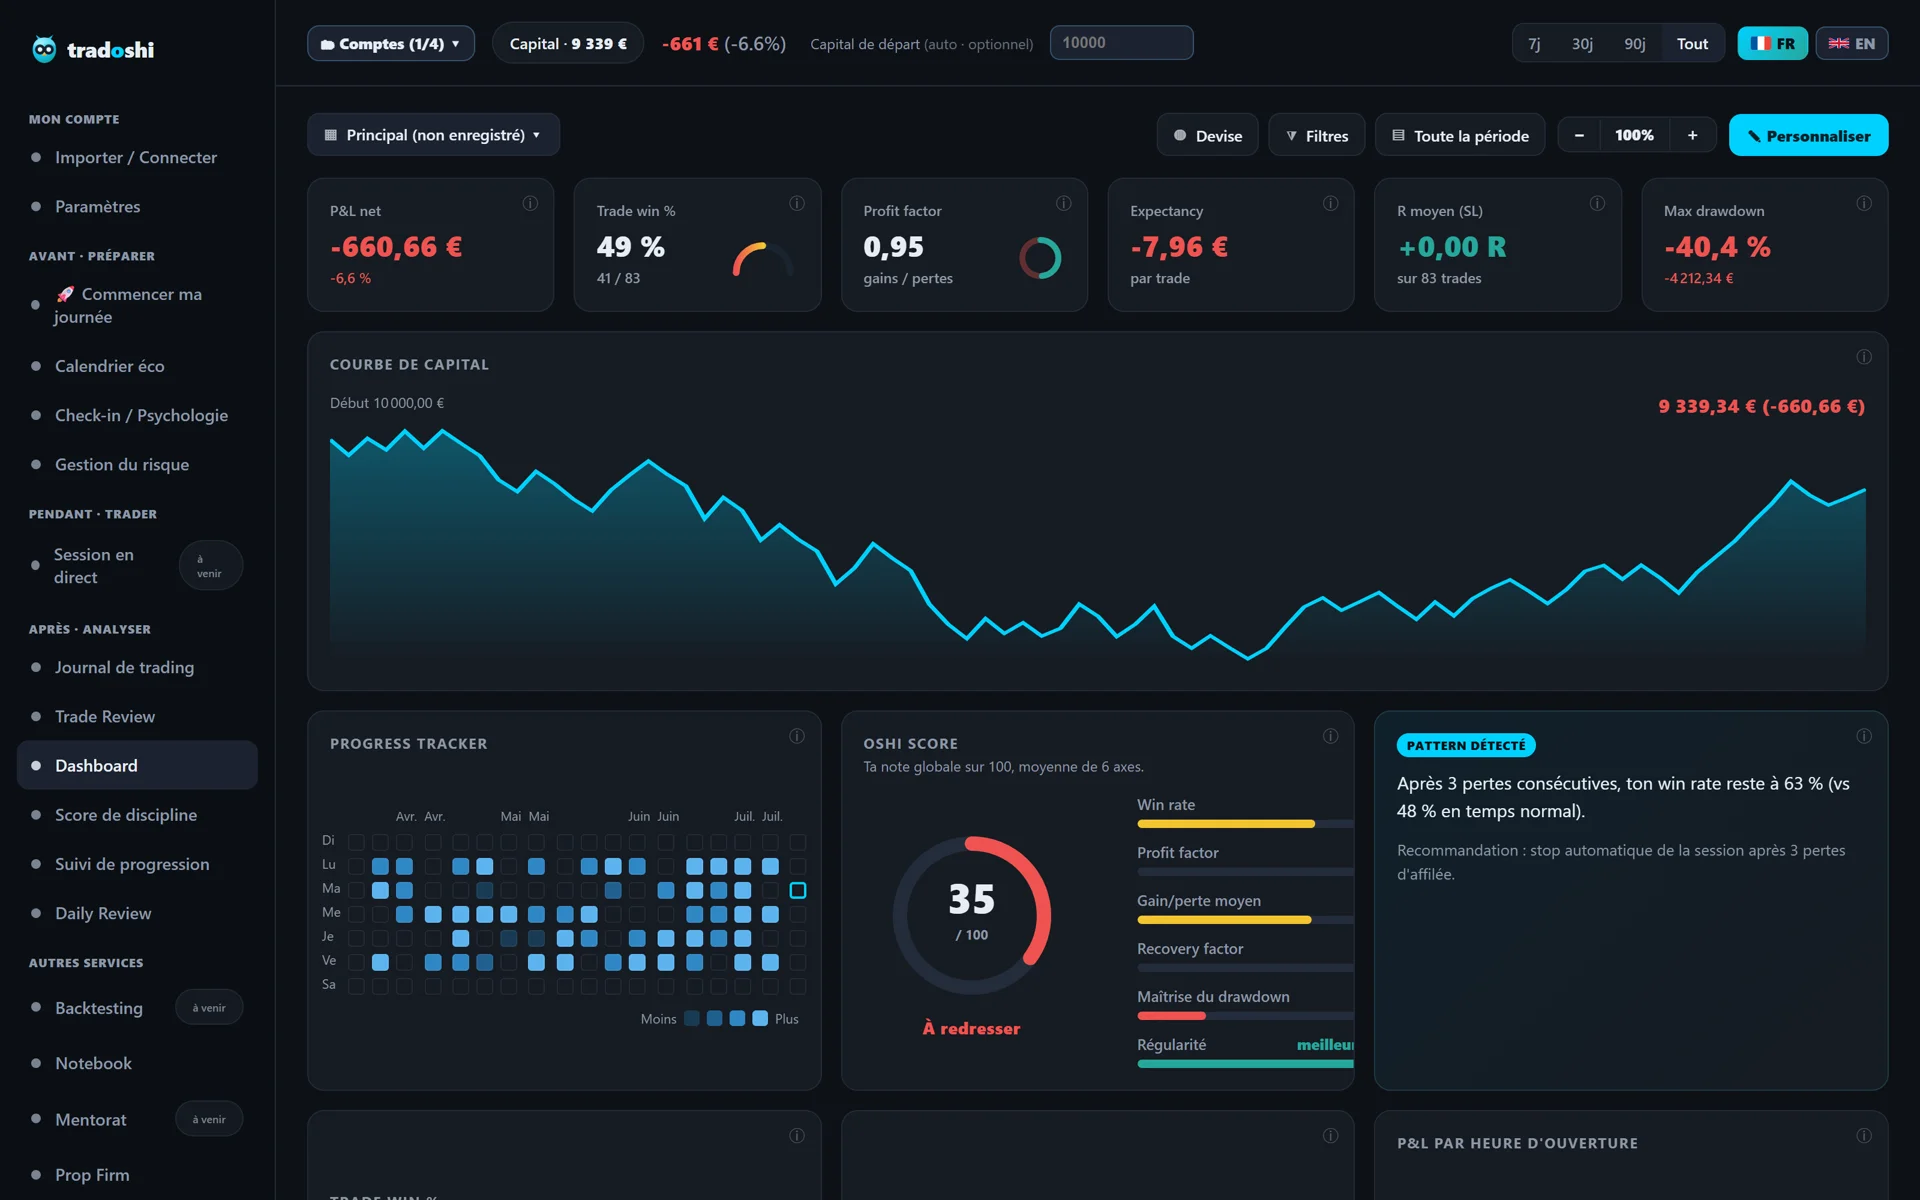
You trade well, but you can't break through.
A plateau is almost never a strategy problem. It's a visibility problem: without granular data, you cannot tell skill from luck.
You make +2,000 one week, -500 the next, with the same setups. No way to tell what actually changed between them.
The same mistakes keep coming back (revenge trading, doubled size, late entry) but you don't know what each one really costs you.
You journal when things go badly, then stop when they go well. Without consistency, no trend ever shows up.
You sense the leak sits somewhere between entry time, day, instrument and your state of mind, without being able to pin it down.
The difference between your good and bad days, quantified.
Four analytics that turn a hunch into a decision: what to keep, what to fix, what to stop.
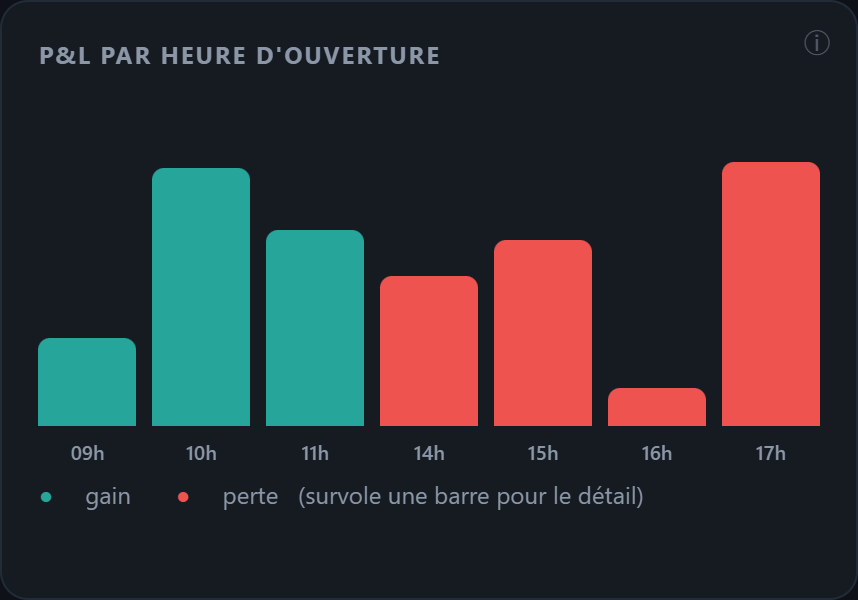
Compare your green days to your red days
Your results are broken down by weekday, entry time and session. You see in black and white that you lose after 3 pm, or that Thursday costs what Friday earns. These are facts, not impressions.
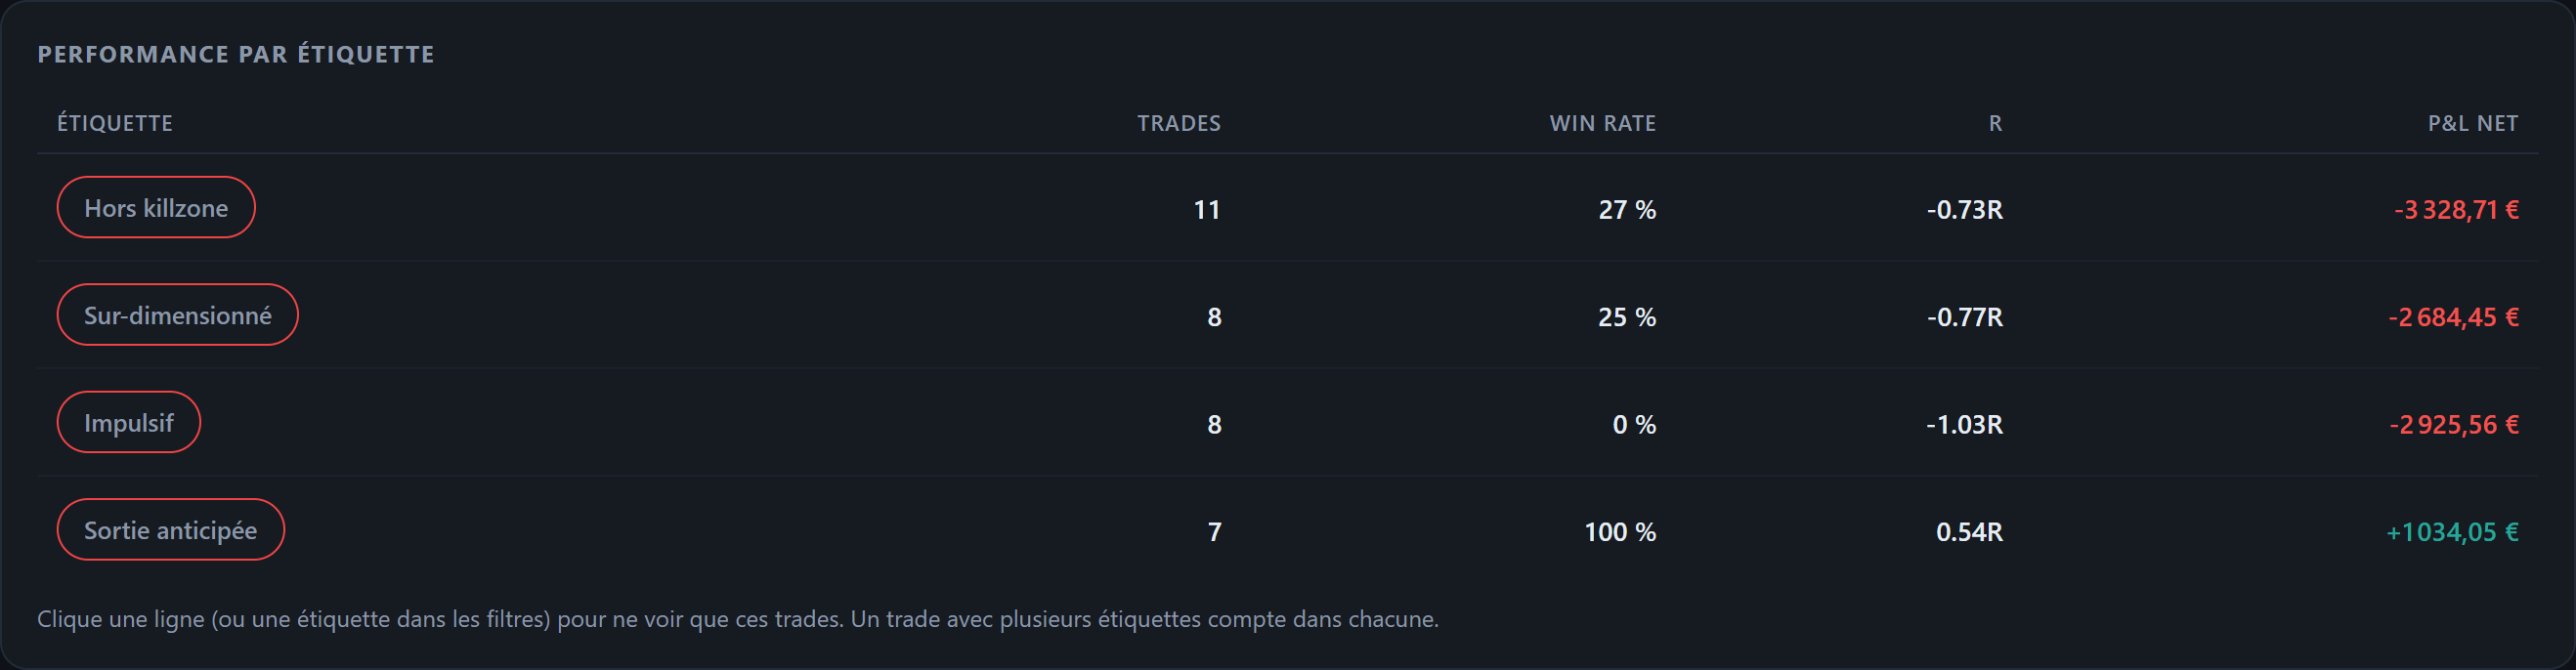
Quantify the mistakes that cost you most
Tag your trades (FOMO, revenge, oversized, plan broken) and Tradoshi adds up the real cost of every tag. You stop fixing at random: you start with the one that weighs the most.
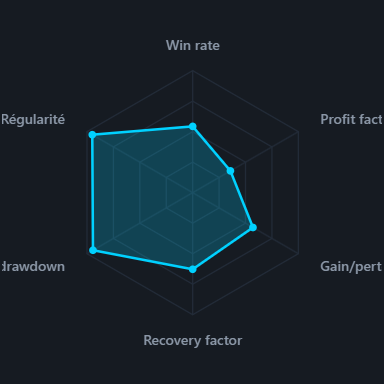
Track your consistency, not just your P&L
The Oshi Score rates your discipline, risk management and process adherence across 6 axes. A week can be green on a bad process: that's the one that hurts you the month after. The score sees it before your account does.
Replay your losses to stop repeating them
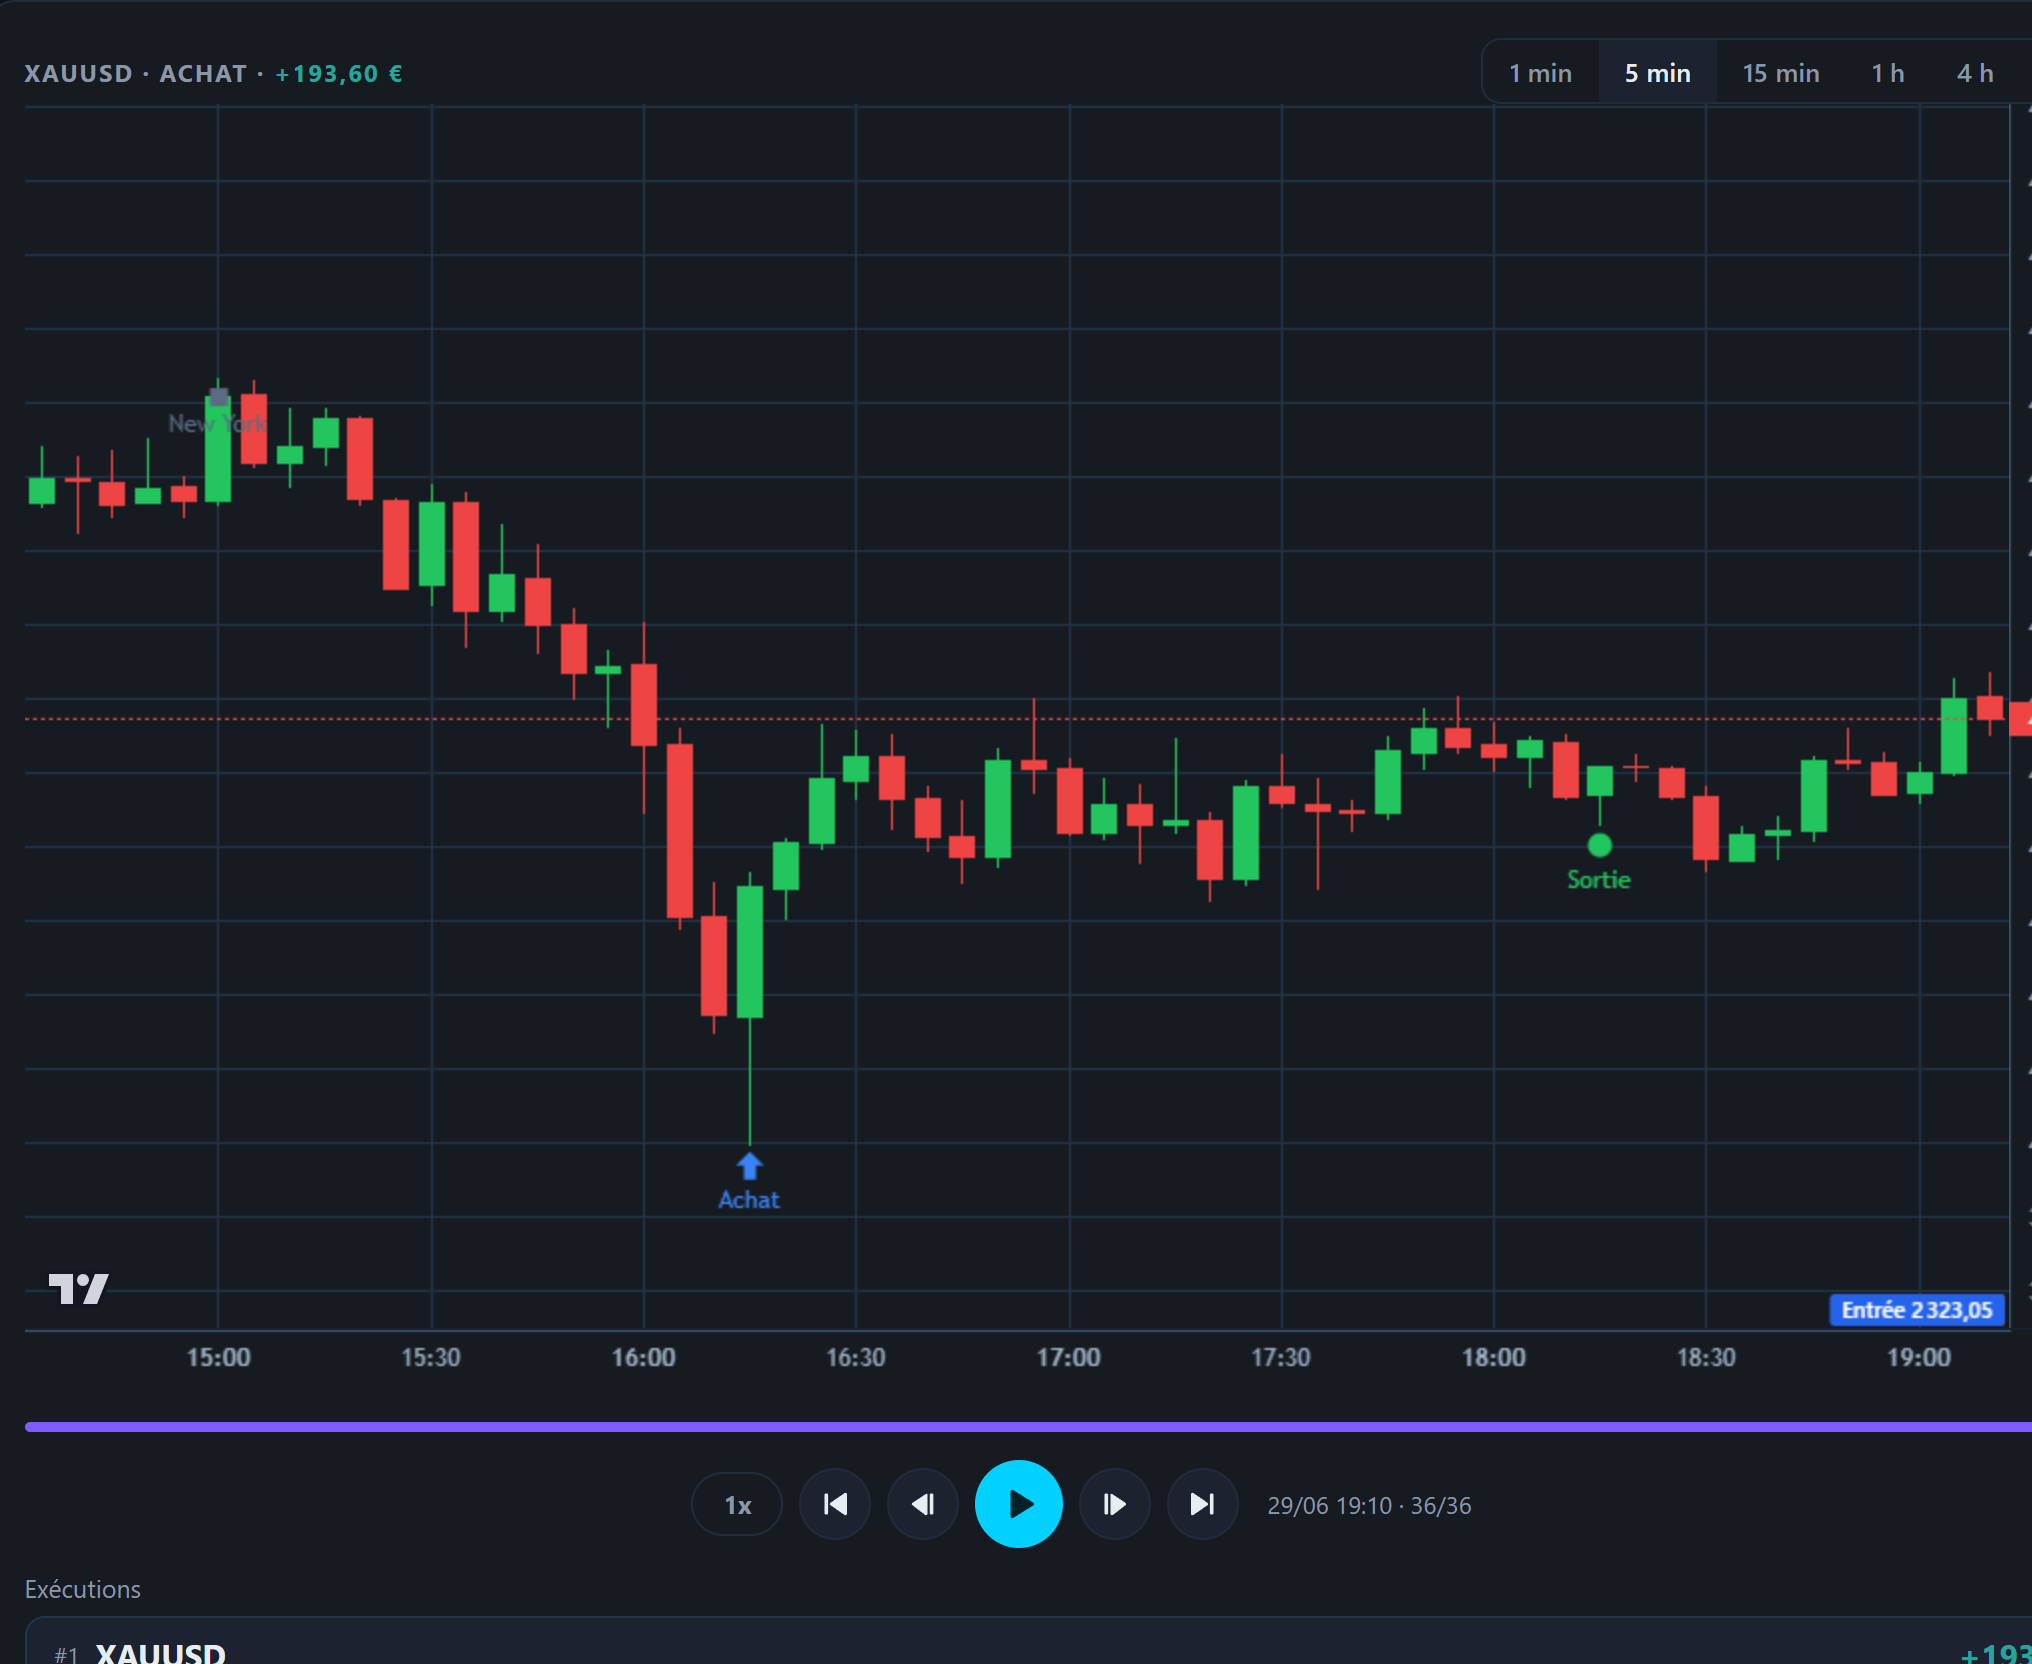
Trade Review replays every trade on real candles, with your entry, stop and exit. You see the exact moment you drifted from the plan, and why. That's where fixing it becomes concrete.
A coach that tells you what to fix first.
Oshi reads your entire journal, not generic averages. It compares your winning and losing streaks, spots what separates them, and gives you one single thing to fix this week. Not ten.
today's analysis
Your green weeks have one thing in common: 4 trades a day, maximum. Your red weeks climb to 9. It isn't your setup breaking down, it's your volume.
Build the consistency missing between two good weeks.
Backtesting
Test an adjustment on historical data, candle by candle, before risking a cent on it. Proof before capital.
Morning routine
Daily analysis, plan and check-in before the open. Prepared days don't look like the others, and you can prove it.
Emotional check-in
Thirty seconds of voice before you trade. Tradoshi ties your state of mind to your results and shows you the link you can't see.
Discipline score
Adherence to your own rules, measured daily. It's the metric that improves before the money follows.
Three steps, once.
Connect your account
Automatic sync with your broker, or import your statement. Your whole history lands at once, with no manual entry.
Tag, and let it run for two weeks
Mark your setups and your deviations from plan. Consistency is what surfaces trends, not the volume of notes.
Fix one thing at a time
Attack the most expensive mistake, check the effect on your score the following week, then move to the second.
What you're probably wondering.
I already journal in a spreadsheet, what changes?›
How long before a trend appears?›
How do I know whether it's my strategy or my execution?›
I trade several setups, can I compare them?›
Do I have to journal every day for this to work?›
Ready to go from good to consistent?
You already have the skills. Get the data that shows where they leak.