Drop your broker statement: within a minute you see the loss you chased too fast, the trade that went green then finished red, and your worst day. No credit card, no end date, and nothing to connect.

No card to hand over, no end date, nothing to cancel. Open your journal today and it is still there in two years, with all your history.
An HTML or CSV file exported from your platform, dropped into the page. Nothing to install, no account to connect, and it's unlimited on every tier.
Your trades land on their own, with the stop, the fees and the currency. Nothing left to type, nothing left to upload.
As soon as your file is read, Tradoshi lays out what it found: your result by weekday, your entry hours, your most frequent behaviours, your Oshi Score, then a card for your two worst and two best trades. This is where most traders discover their revenge-trading signature: a loss, and a new position reopened within fifteen minutes.
Nothing is guessed and nothing calls an AI: everything is computed from the real executions in your statement. The recap needs at least ten trades; below that, the sample says nothing reliable.
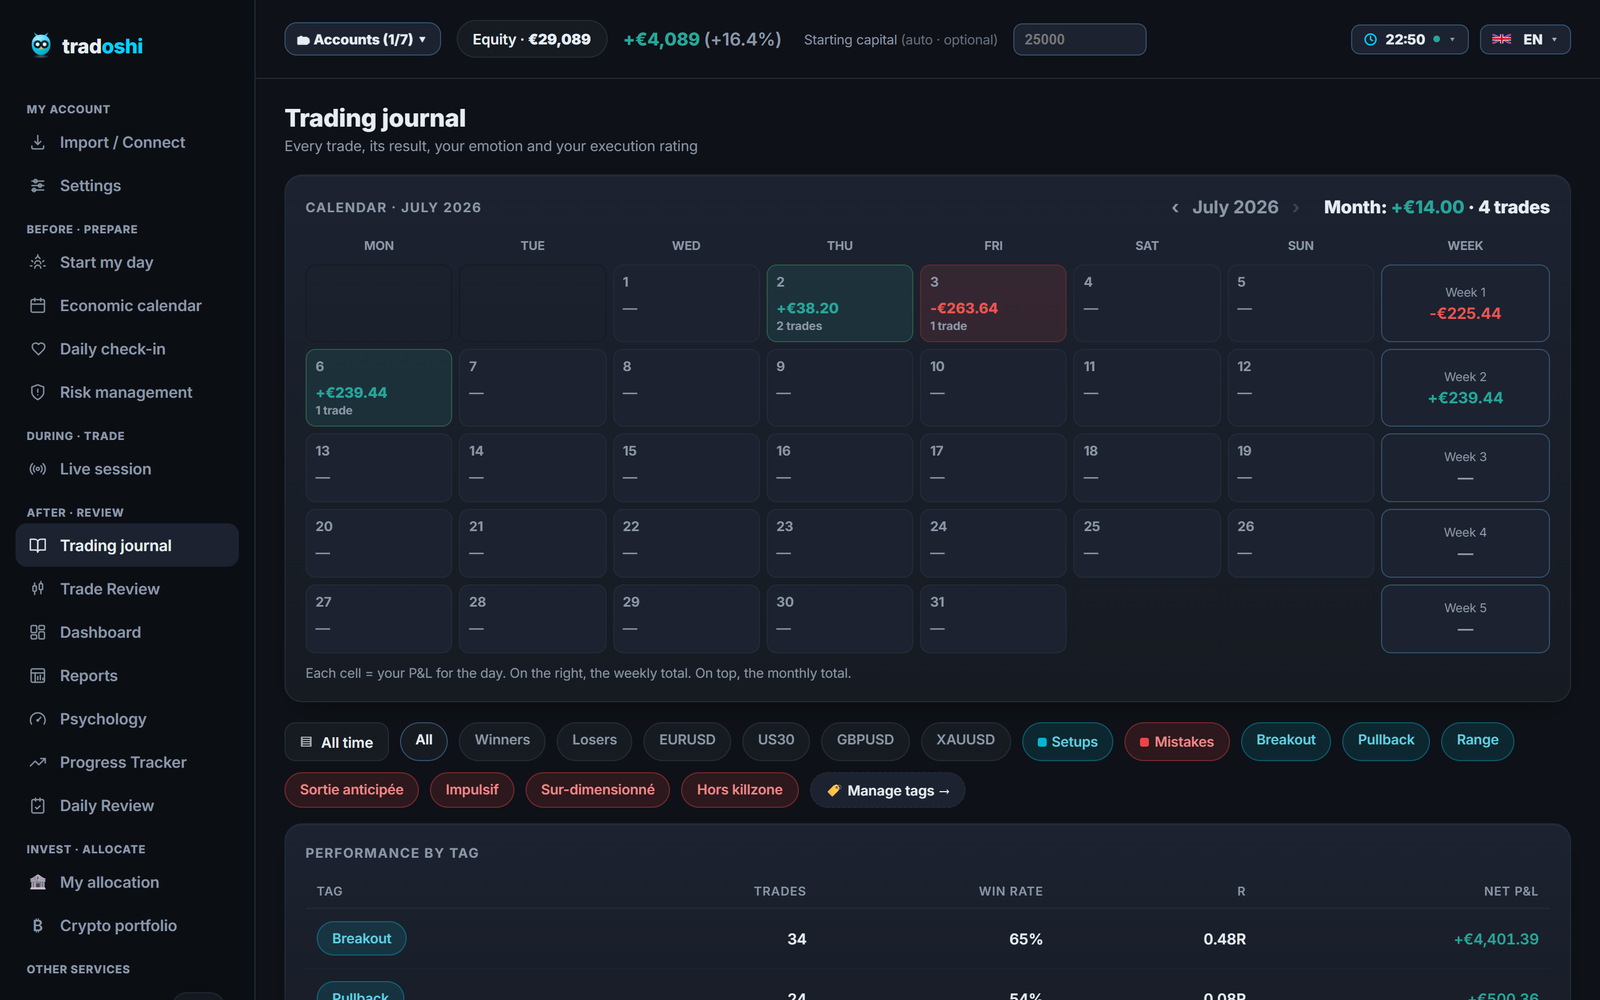
A monthly calendar that tints each day by its result, with the month total on top. Winning streaks, air pockets and the days you should not have opened your platform show up without reading a single number. It opens the Daily Review screen, where your days stack right below it and unfold one by one: summary, P&L, your emotional state that morning, and a warning when a losing session lands on a high-impact news day.
A day's result is counted NET, wins and losses together. That nuance is expensive elsewhere: a session at −8,000 then +6,000 is −2,000, not −8,000.
Win rate, profit factor, expectancy, real R-multiple, win/loss ratio, Sharpe, recovery factor, drawdown. Every metric is computed on your real trades and explained in a public glossary, so you know what you're looking at.
The R-multiple is derived from your real stop loss, without you entering anything: Tradoshi reads it from your orders. And a stop trailed past your entry price no longer counts as risk, because by then there is none.
A report here isn't a page written in advance: it's a metric crossed with a dimension. Fifty-five metrics, twelve dimensions, so over five hundred combinations, all available on the free plan. You pick what to measure and how to slice it.
Three dimensions exist nowhere else: emotional state, market session, and the execution rating you give your own trade. They are the ones that answer “do I trade worse when I'm angry”, a question no spreadsheet knows how to ask.
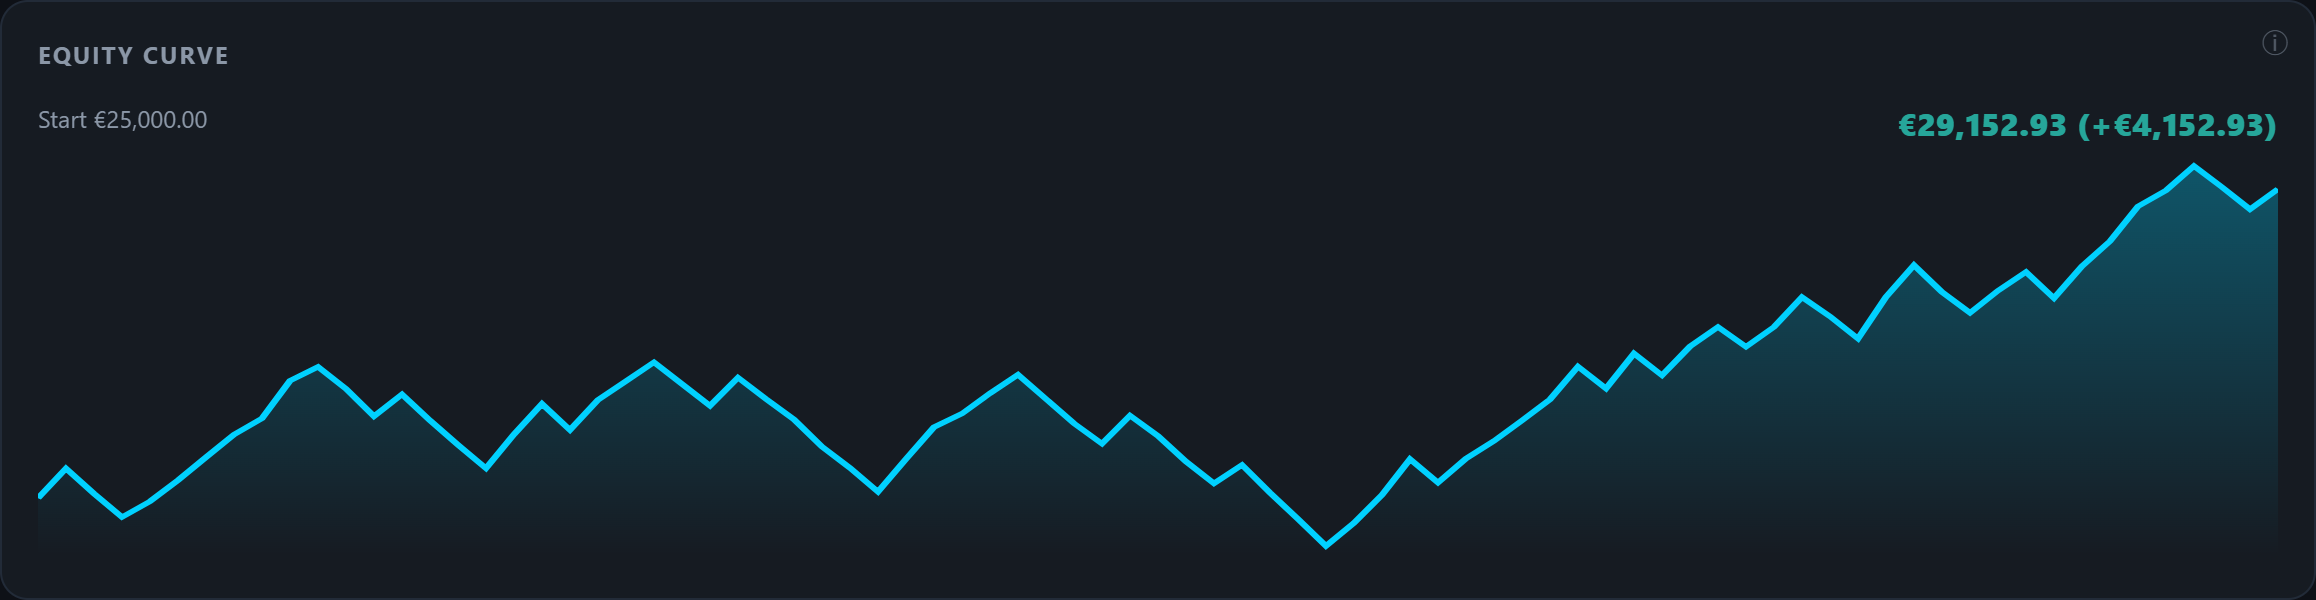
A clean equity curve and an exportable track record. The first person to read it is you in six months, when you want to know whether March really was as good as you remember. The second is whoever coaches you: a mentor, a trainer, a community, shown a measured number rather than a hand-picked screenshot.

One close equals one trade, exactly like your challenge statement, and the daily loss is computed net. Two counting rules are enough to make a journal diverge from the firm that funds you, and make you believe in a blown account that isn't.
Full challenge tracking (profit target, maximum daily loss, static, end-of-day or trailing drawdown, payout threshold) belongs to the Pro plan. The journal, the calendar and the reports are in the free tier.
No feature is half-crippled: either it's here, or it's elsewhere. The line runs along what costs us per use, meaning artificial intelligence, not the number of trades or a countdown.
Count the time it takes to export a file. There is no install, no browser extension, no discovery call.
In MetaTrader 4 or 5, open the Account History tab, right-click, then Report and HTML report. On other platforms and on crypto exchanges, a CSV export is enough: Tradoshi recognises columns by their name, in any order, with a comma, a semicolon or a tab as the separator.
Create your free account, open the import page and drop your file. No broker credentials are asked at this stage, and the operation is unlimited: you can drop three years of history in several passes, or start over as often as you like.
If your export only holds buy and sell executions, as with most stock brokers and exchanges, they get matched FIFO to rebuild the round trips. That avoids the classic mistake: counting two rows where there is one trade, and halving your win rate without noticing.
The free plan includes one account on automatic sync. From then on you drop nothing: trades land on their own, with the stop, the fees and the currency. You can also never use it and stay on file import, nobody will push you.
Seven metric families, all computed without artificial intelligence: they are deterministic operations on your executions, so they sit in the free plan and they will give the same result tomorrow.
Net and gross P&L, average win, average loss, biggest win, biggest loss, commissions, swap, total cost. Fees are counted, never dropped: they are often what separates a profitable strategy from a break-even one.
Number of trades, winners, losers, break-even, total and average volume, trading days, trades per day. The underlying question is always the same: are you overtrading?
Win rate, profit factor, expectancy, win/loss ratio, average realised R, average percentage of capital risked, maximum winning and losing streaks, Sharpe ratio, maximum drawdown and recovery factor.
Average holding time, measured separately on winners and on losers. The gap between the two is one of the most telling numbers in a journal: holding losses longer than wins is the most widely shared reflex in this job.
Winning and losing days, daily win rate, average P&L of a winning and of a losing day, best day, worst day, longest day streaks. The right unit for an intraday trader isn't the trade, it's the session.
The best and worst moment each position went through while it was open, in currency and in R, plus exit efficiency and money left on the table. An MFE far above your result means you exit too early; an MAE far below your stop means you can tighten it, and therefore size up at equal risk.
Average execution rating, share of trades carrying a stop loss, share of trades where you tagged an emotion, plan adherence. These are the only measures of what you actually control.
Almost everyone starts with a spreadsheet, and that's a fine start. A spreadsheet forces you to write down what you did, it costs nothing, and it belongs to whoever keeps it. That's not the problem. The problem is that a spreadsheet never fills itself, and the column you stop filling in is exactly the one you would have needed three months later.
Then there is a family of numbers a spreadsheet will never produce, however long you spend on it, because they simply aren't in your statement.
That said, if you want to start with a spreadsheet, take ours: our Excel journal template is free to download, no signup. It does the first three months' job perfectly well, and the day you've had enough of filling it in on Sunday night, your statement will import here in a minute.
This is the best covered case, because MetaTrader 4 and 5 expose the stop loss inside the order itself. The R-multiple is therefore real, not estimated. One thing to know: MetaTrader only records a stop if it is attached to the entry order or if it triggers. A stop placed afterwards and never touched leaves no trace in the statement. When that happens, Tradoshi leaves the cell empty and says why, rather than inventing a risk figure. Details in our forex journaling guide.
Here the counting rule beats everything else. Your prop firm counts one close as one trade and measures your daily loss net: a journal that counts differently will tell you that you broke a rule while the firm says the opposite, or worse, the other way round. Tradoshi aligns with the firm. Contracts whose tick value isn't known are declared by hand at import time, which avoids converting points into euros at random. See the futures journaling guide.
Exchanges export executions, rarely closed positions, and each names its columns its own way. That's exactly why the import recognises headers by alias and matches FIFO. Stops, though, are rarely present in exchange files: the R-multiple will stay empty on those trades, and the app says so instead of hiding it. See the crypto journaling guide.
The case where FIFO matching matters most, because a round trip almost always arrives as two rows. Without matching, an account with ten round trips of which six are winners shows twenty trades and a 30% win rate instead of 60%. That is not a display typo: it is the maximum losing streak, and therefore the “I stop after three losses” guardrail, that becomes wrong.
Better written here than discovered after signing up. Four things stay outside the free tier, and that's deliberate.
One clarification we would rather give straight, because many tools stay vague about it: your journal is kept server-side, not only in your browser. That is exactly what lets you find it again on another device, or after clearing your cache, without resyncing anything. It is readable only by you, and by a mentor you explicitly invited, on the accounts you shared with them.
Yes, with no hidden catch: no credit card asked, no end date, nothing to cancel. The free plan is a permanent tier of the offer, not a trial period. The 7-day trial with a card does exist, but only on the paid plans, for people who want to test Oshi or several synced accounts.
No, not for file import: you drop a statement exported by your platform, and that's it. Automatic sync does need to be able to read your account, and it stays optional. Plenty of traders use Tradoshi for months without ever connecting anything.
HTML reports from MetaTrader 4 and 5, and CSV files from most platforms, brokers and exchanges. Columns are recognised by name, in any order, with comma, semicolon or tab as the separator. If your file only holds executions, they get FIFO-matched to rebuild your positions.
2,122 brokers and platforms in total, 98 of them through a direct broker API. The full list is published and verifiable: see the supported brokers. If yours isn't there, file import still works.
P&L is never recomputed by us: it comes from the broker, fees included, and the total matches your statement to the cent. What is computed are the statistics derived from it, and they are locked down by an automated test suite whose ability to fail has been verified. An aberrant value, such as a mistyped stop that would imply risking 149% of capital, is flagged and pulled out of averages, never deleted.
On our servers, which is what lets you find your journal and your annotations again on another device, or after clearing your browser cache. Access is restricted to your account, plus a mentor you invited yourself, and only on the accounts you shared with them. No credential allowing an order to be placed on your behalf is of any use to us.
Yes. You can tag, annotate, rate your execution, add your emotion and group partial entries of the same position. Your edits survive every sync: a resync never overwrites what you wrote.
Nothing. Your journal stays open, your trades stay there, your statistics keep being computed. There is no countdown, no trade cap, no screen that closes after thirty days. The only ceiling on the free plan is the number of synced accounts, set to one.
The journal does, and that's where it's most useful, because it counts the way your firm counts: one close per trade, and a daily loss measured net. Full challenge tracking, with the profit target, maximum daily loss, static, end-of-day or trailing drawdown, and payout threshold, belongs to the Pro plan.
Yes. The equity curve and the track record export, and your trades stay yours. A journal that retains users by holding their data hostage isn't a journal, it's a trap.
No, nothing is required: Tradoshi opens in the browser, on desktop as well as on phone. On Android the app also exists on Google Play. On iPhone it is not submitted yet.
Our guides on journaling, method and tools.
Free plan, no credit card and no time limit.