 By Benjamin Roure L'Hermitte
A well-built trading journal spreadsheet turns scattered trade notes into a practical feedback system. Whether you prefer Excel, Google Sheets, or a simple downloadable template, the goal is the same: record each trade clearly, review your behavior honestly, and make better decisions over time. The right spreadsheet does not need to be complicated; it needs to be consistent, accurate, and easy enough to use after every trading session.
You can get the Tradoshi Excel trading journal template for free by email, with the columns and the formulas already in place: click the button below, enter your address and it arrives as an attachment.
What should a trading journal spreadsheet actually track?
A useful trading journal spreadsheet should track the data that explains both the result of a trade and the decision-making behind it. That means more than entry price, exit price, and profit or loss. A good journal captures risk, setup quality, execution, market context, and emotional state so you can see why certain trades worked and why others failed.
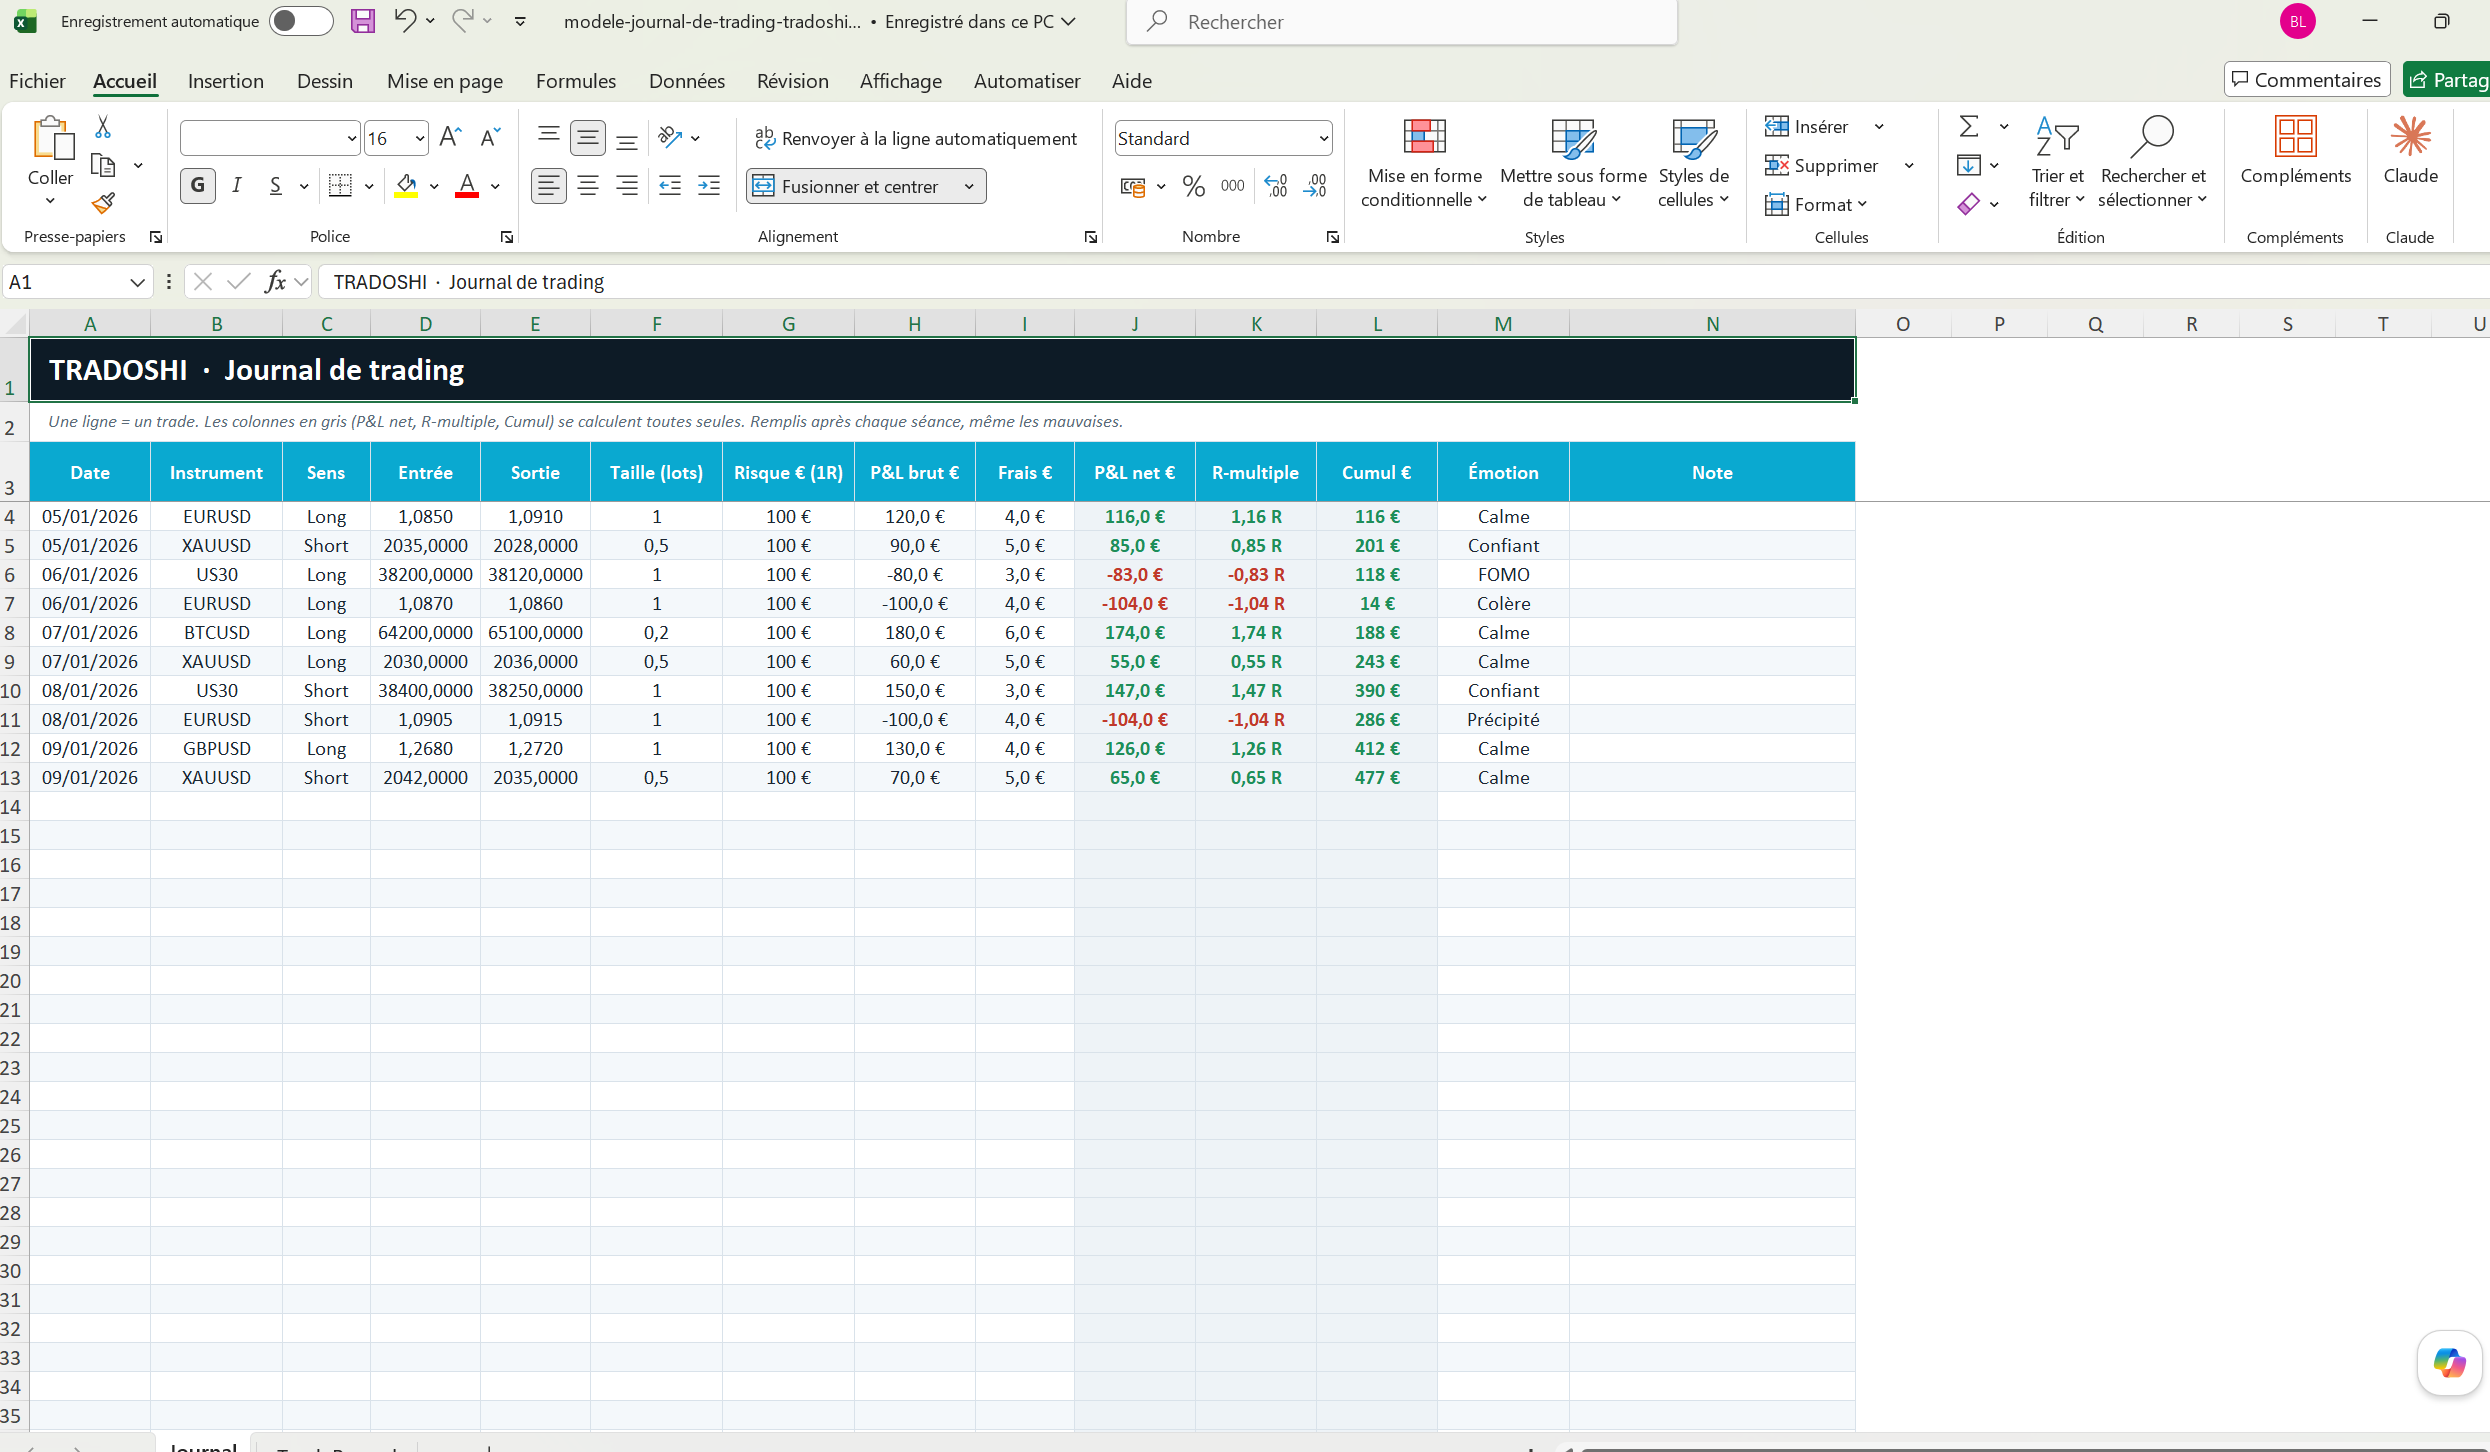
Each row of this trade journal Excel file is one trade: you fill in the white columns, and the grey ones (net P&L, R-multiple, running total) calculate themselves. Here is what goes in each of the fourteen columns, with the first example row of the template.
The trade journal spreadsheet template columns, one by one
| Column | What goes in it | Example | Filled by |
|---|---|---|---|
| Date | The day you opened the trade | 2026-01-05 | You |
| Instrument | The pair, index, stock or contract | EURUSD | You |
| Direction | Long or short | Long | You |
| Entry | Your fill price | 1.085 | You |
| Exit | Your exit price | 1.091 | You |
| Size (lots) | Lots, shares or contracts | 1 | You |
| Risk USD (1R) | What you stood to lose at your stop | 100 | You |
| Gross P&L USD | The result before costs | 120 | You |
| Fees USD | Commission and swap (the spread is already in your fill prices) | 4 | You |
| Net P&L USD | The result after costs | 116 | Formula: =H4-I4 |
| R-multiple | Net result divided by your 1R | 1.16 | Formula: =J4/G4 |
| Running total USD | Your cumulative net P&L | 116 | Formula: =SUM($J$4:J4) |
| Emotion | How you felt when you took the trade | Calm | You |
| Note | One line on why you entered and what you did | London breakout, followed the plan | You |
Four columns are worth adding once logging is a habit: your stop and target, to check there was a plan before entry; the setup name, to see which pattern really pays; the session (London, New York); and an execution note (chased the entry, moved the stop, exited early). Add them one at a time: a sheet that takes too long to fill in ends up abandoned.
This is where a trading spreadsheet becomes more than a record book. It becomes a mirror. If your best trades happen when you follow one setup and your worst losses happen after impulsive entries, the data will make that pattern difficult to ignore.
The best Excel templates keep the process simple
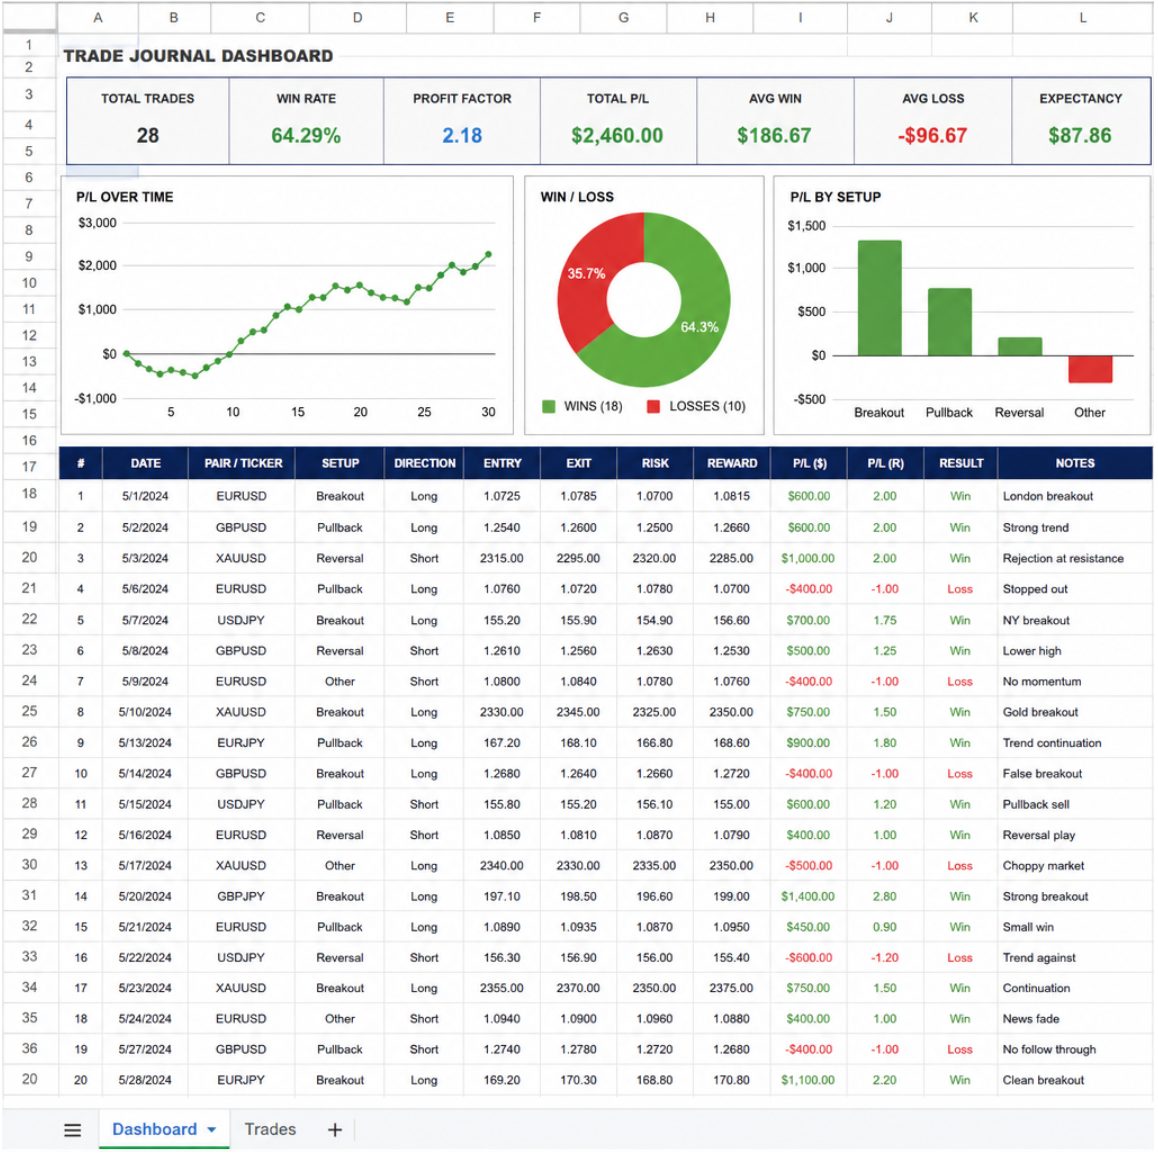
Many traders start with Excel because it is familiar, flexible, and powerful enough for most manual tracking needs. You can sort, filter, calculate, format, and build summary views without paying for specialized software. A clean Excel template can also be customized for your strategy instead of forcing you into somebody else's workflow.
The most effective spreadsheet is usually the one you will actually use. A template with fifty columns may look impressive, but if it takes too long to update, it can become another abandoned trading tool. Start with the essential fields, then add detail only when it helps you make better decisions.
A practical Excel template has two main areas:
- Trade log sheet: Where you enter individual trades.
- Summary sheet: Where formulas calculate performance metrics automatically.
Useful summary metrics include:
- Total net P&L
- Win rate
- Average winning trade
- Average losing trade
- Largest win and largest loss
- Total number of trades
- Profit by setup
- Profit by market or symbol
- Monthly performance
- Average R-multiple
Four Excel functions cover most of that list, each documented by Microsoft: the COUNT function in Excel for the number of trades, the COUNTIF function in Excel for the winners, the AVERAGEIF function in Excel for the average win and loss, and the SUMIF function in Excel for gross profit and gross loss. Google Sheets takes them under the same names, as the Google Sheets function list shows. Profit factor is gross profit divided by gross loss, and expectancy is the average result of one trade: those are the definitions of Profit Factor and Expected Payoff in MetaTrader 5's documentation of its testing report.
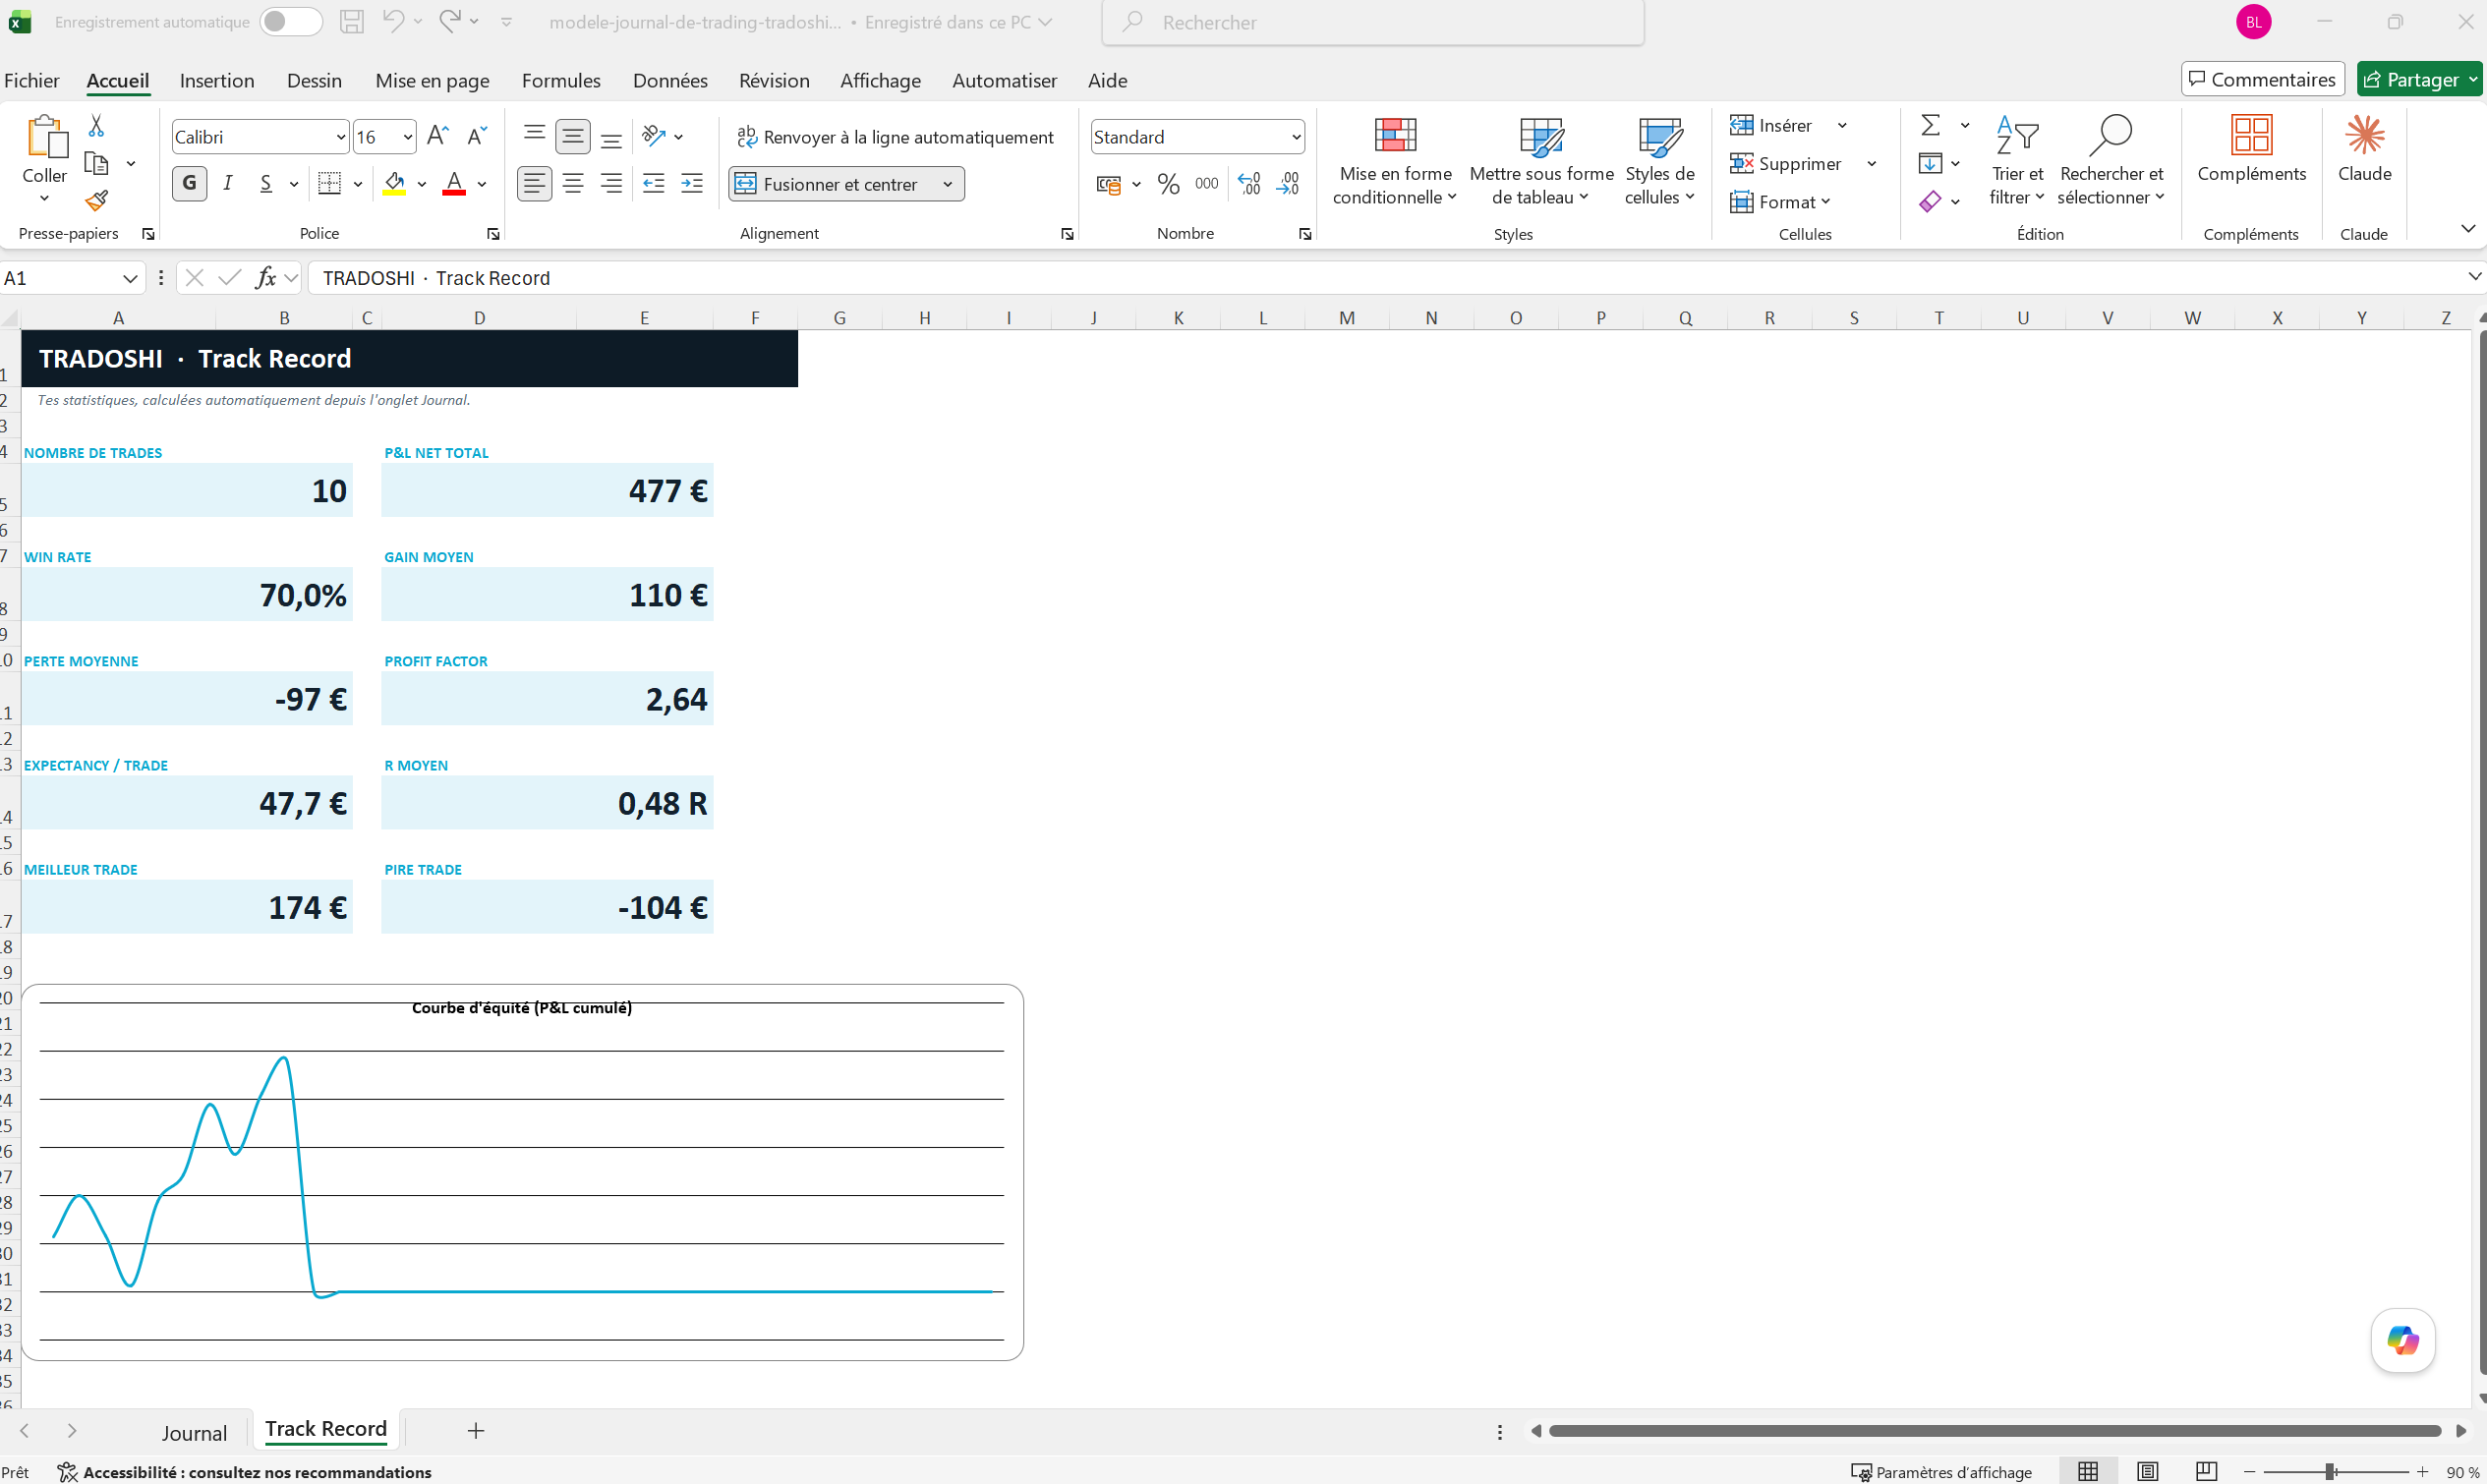
If you download a trading journal Excel template, pick one that already includes its formulas but still lets you edit them. Avoid templates that hide too much or make it hard to understand how your numbers are calculated. A transparent trading journal Excel file helps you trust the results and learn from the structure.
How to create a trading journal in Google Sheets?
To create a trading journal in Google Sheets, build one sheet for trade entries and one sheet for summaries, then use formulas to calculate P&L, win rate, and risk-based performance automatically. Google Sheets is especially useful if you want cloud access, easy sharing with a mentor, or the ability to update your journal from multiple devices.
Here is a simple setup process:
- Create your trade log columns. Add columns for date, symbol, direction, entry, exit, size, stop loss, target, fees, setup, emotion, notes, and result.
- Add a P&L formula. For long trades, P&L is typically based on exit price minus entry price, multiplied by position size, minus fees. For short trades, reverse the price calculation. If you trade multiple position types, add a direction column so the formula can adjust.
- Track planned risk. Calculate the distance between entry and stop loss, then multiply by position size. This shows the risk you accepted at entry.
- Calculate R-multiple. Divide net profit or loss by planned risk. A trade that makes twice the initial risk is a 2R trade. A trade that loses the planned risk is a -1R trade. The measure comes from Van Tharp, who relates every profit and loss to that initial risk (Van Tharp Institute trading concepts).
- Create a dashboard sheet. Use summary formulas to show total trades, winning trades, losing trades, average R, net P&L, and performance by strategy.
- Protect formulas. Lock or visually separate formula cells so you do not accidentally overwrite your calculations: in Google Sheets, open Data, then Protect sheets and ranges (Google's help on protecting sheets and ranges).
A Google Sheets trading journal is ideal for traders who want portability. When you pick a template, prioritize one that is easy to duplicate, customize and review. A free template deserves the same scrutiny as a paid one, and a good one should not require a complex setup before you can start logging trades. Ours does exactly that: the email that sends you the Excel file also carries our trading journal Google Sheets template, and one click makes your own copy, with the formulas and the Track record tab in place.
Match your journal to your market
A single trading log spreadsheet can work across markets, but small adjustments make it much more useful. A stock trader, forex trader, futures trader, options trader, and funded account trader all need slightly different information.
For stocks, a stock trading journal Excel template should focus on ticker, share size, entry, exit, position value, fees, sector, catalyst, and setup. If you trade breakouts, pullbacks, earnings reactions, or momentum names, label those setups clearly so you can compare them later.
For forex, add currency pair, session, lot size, pip value, spread, and time zone. Log the pip value at the time of the trade: when the quote currency is not the US dollar, a dollar account has to convert the result at the dealer's rate, as the National Futures Association's guide to retail forex spells out. Session data can be especially helpful because some traders perform better during London, New York, or overlap periods.
For futures, track contract type, tick value, number of contracts, session, and daily risk limits. Since futures can move quickly, execution notes are especially valuable.
For options, include contract type, strike, expiration, premium, number of contracts, strategy, implied volatility notes, and whether the trade was closed, assigned, or expired.
For prop firm or funded account trading, your trade tracker spreadsheet should include drawdown, daily loss limits, maximum loss rules, and payout-related notes. Passing a challenge is not only about profit; it is also about staying within the rules. FTMO, for one, requires all of its objectives to be met at the same time, and equity dropping below the maximum daily loss limit counts as a violation (FTMO's trading objectives).
Build a feedback loop, not just a record
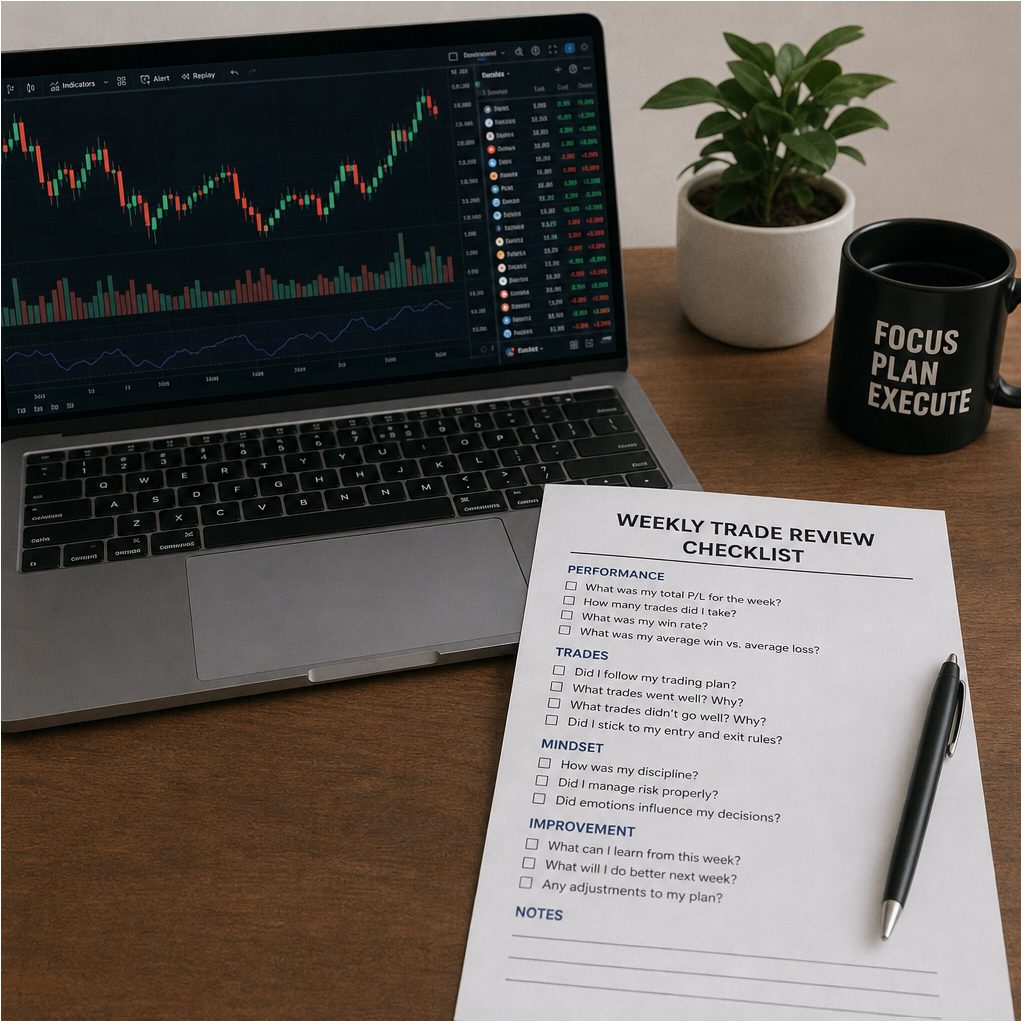
Logging trades is only the first step. The real value comes from reviewing your data on a schedule and turning those observations into rule changes. Without review, even the best Excel trading journal template becomes a storage file instead of a performance tool.
A simple review rhythm works well for most traders:
- After each trade: Enter the facts while they are fresh. Add emotional notes before hindsight changes the story.
- End of each day: Check whether you followed your plan, respected stops, and avoided unnecessary trades.
- End of each week: Review performance by setup, time of day, symbol, and emotional state.
- End of each month: Decide what to keep, reduce, remove, or test next.
During your review, look for patterns rather than isolated wins or losses. A profitable trade can still be a bad trade if you broke your rules. A losing trade can still be a good trade if you followed a valid plan and controlled risk. Your journal should help you separate process quality from outcome, which does not come naturally: in the experiments of Baron and Hershey, people rated the same decision as better when its outcome was favorable, including those who said outcomes should not count. And once the outcome is known, people overestimate what they would have known without it, as Fischhoff showed, hence the advice to write your notes before the result comes in.
For example, you may discover that your morning breakout setup has a positive average R, but your late-day continuation trades consistently lose money. Or you may notice that trades marked « frustrated » or « rushed » produce your largest drawdowns. Those insights are the reason a trade tracking spreadsheet matters. The emotion column has research behind it: Lo, Repin and Steenbarger asked 80 day traders to rate their mood every evening for five weeks; 69 returned reports, 755 in all over 25 trading days, and those whose mood reacted most to their gains and losses had worse results.
Spreadsheet templates and automated journals both have a place
A manual trading spreadsheet is a smart starting point because it is low-cost, customizable, and forces you to pay attention. When you type in every trade, you become more aware of position size, risk, fees, and behavior. This is especially useful for beginners building discipline.
However, spreadsheets have limits. Manual entry takes time, mistakes happen (the inspections of spreadsheets in real use compiled by Raymond Panko found errors in 94% of the 85 files examined), and advanced analytics can become difficult as trade volume grows. If you trade frequently, use multiple brokers, or need chart screenshots and automatic imports, dedicated journal software may save time.
Consider staying with a spreadsheet if:
- You take a manageable number of trades each week.
- You want a free trading journal template before paying for tools.
- You prefer full control over columns and formulas.
- You are still learning which metrics matter to your strategy.
- You mainly need accountability and basic performance tracking.
Consider upgrading to software if:
- Manual entry causes you to skip journaling.
- You trade many positions across different markets.
- You need broker import, tagging, charts, or advanced filtering.
- You want faster review of setup performance and execution mistakes.
- Your spreadsheet has become too complex to maintain confidently.
There is no need to choose permanently. Many traders begin with a spreadsheet, then move to automated tools when their volume or analysis needs increase. Others keep their Excel file because it keeps them close to the details.
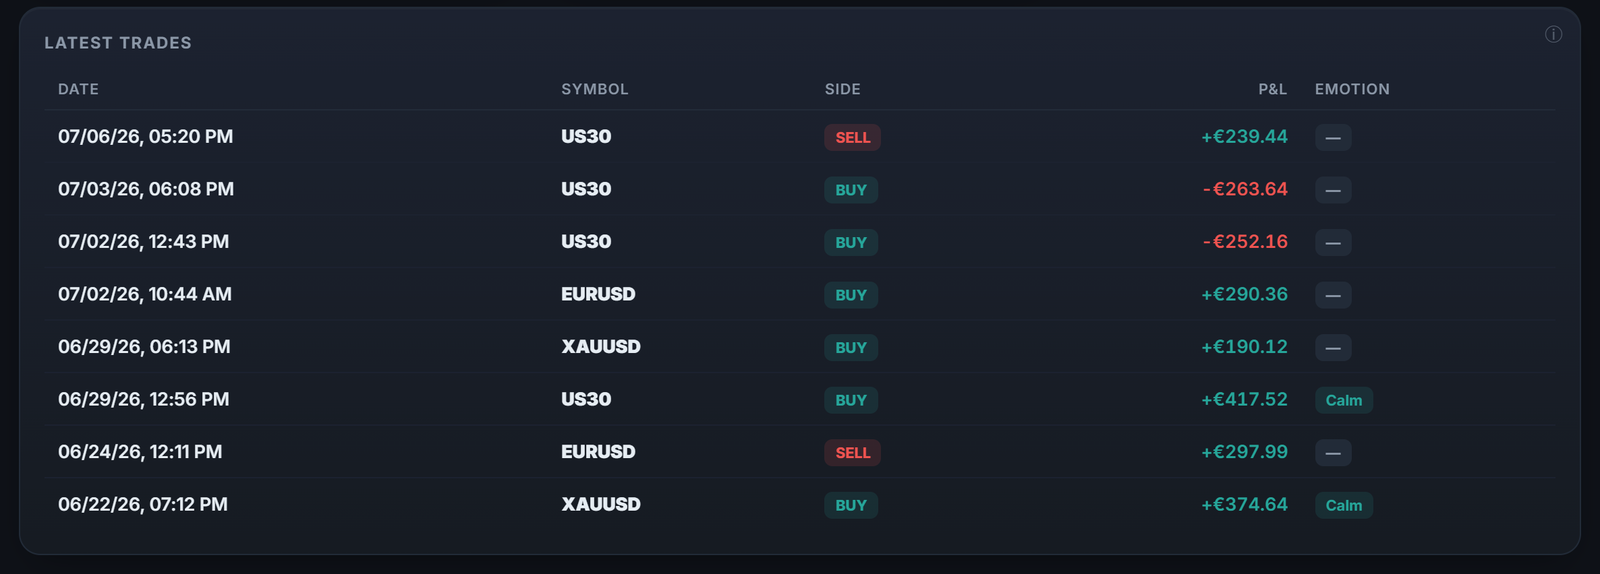
Common mistakes that weaken your journal
Even a strong template will not help if the habits around it are weak. The spreadsheet is only as honest as the information entered into it.
Watch for these common problems:
- Skipping losing trades: This hides the most valuable lessons.
- Ignoring commissions and fees: Small costs can change the true performance picture. On the Taiwan Stock Exchange from 1995 to 1999, the most active day traders made money before costs and lost money after them, Barber, Lee, Liu and Odean found.
- Writing vague notes: « Bad trade » is less useful than « entered late after missing first signal ».
- Changing the story after the result: Record your plan and emotion before you know how the trade ends whenever possible.
- Tracking too much too soon: A crowded sheet often leads to inconsistency.
- Never reviewing the data: Logging without review does not create improvement.
Keep your journal practical. If a column does not help you make a decision, remove it. If a missing field would help explain repeated mistakes, add it. The best Excel trading journal template is not the most complex one; it is the one that helps you act with more clarity.
A simple starting structure for your own template
If you want to build rather than download, start with a clean layout and expand gradually.
Use this basic structure:
- Sheet 1: Trade Log. Enter every trade with date, symbol, direction, entry, exit, size, stop, fees, setup, emotion, notes, and result.
- Sheet 2: Performance Dashboard. Summarize total trades, net P&L, win rate, average win, average loss, and average R.
- Sheet 3: Setup Review. Group trades by strategy so you can identify your strongest and weakest ideas.
- Sheet 4: Monthly Review. Write a short summary of what improved, what repeated, and what rule you will focus on next month.
This structure gives you the benefits of a trading log spreadsheet without overwhelming you. The same four sheets work just as well in Excel as in Google Sheets.
Turn your journal into better trading decisions
A spreadsheet will not make trades for you, but it can show you what your memory misses. It can reveal which setups deserve more attention, which habits are costing money, and whether your risk is aligned with your plan. Used consistently, a trading journal spreadsheet becomes one of the most practical tools in a trader's routine.
Start simple. Choose a free trading journal template, customize the fields to fit your market, and commit to logging every trade honestly. Whatever tool you use, the real edge comes from reviewing the data and applying what it teaches before the next trade.
Frequently asked questions
How do I make a trading journal for free?
In Excel or Google Sheets. Create one row per trade with columns for date, instrument, direction, entry, exit, stop, size, net P&L, emotion, then add a few formulas (win rate, profit factor, expectancy) to get your stats. Excel for the web is free, Google Sheets only asks for a Google account, and that is enough to start.
What columns should a trading journal Excel have?
The bare minimum: date/time, instrument, direction (long/short), entry price, exit price, stop loss, size, gross P&L, fees, net P&L, R-multiple, emotion and a note. Net P&L and emotion are the two columns not to skip.
How do I compute my win rate in Excel?
With the formula =COUNTIF(pnl_range,">0")/COUNT(pnl_range). It divides the number of winning trades by the total number of trades. But never judge your trading on win rate alone: always read it alongside your win/loss ratio.
Excel or Google Sheets for a trading journal?
Both work. Google Sheets is handier if you want to access it anywhere and share it (with a mentor, for example); Excel takes more data (1,048,576 rows per sheet) and works offline, though a trading journal comes nowhere near the limits of either. Notion suits notes better than statistics.
Is an Excel journal enough, or do I need an app?
Excel is enough to start and learn the basics. Its limits come fast: tedious manual entry (which people end up abandoning), formula errors, no broker sync, no automatic emotional tracking. A dedicated app becomes worthwhile as soon as entry makes you drop the journal.
How do I compute a trade's R-multiple?
1 R is your distance between entry and stop (your initial risk). The R-multiple = the trade's gain (or loss) divided by that initial risk. A gain of twice the risk = +2 R, a stopped-out trade = −1 R. It's what lets you compare trades of different sizes on the same scale.
How often should I fill my trading journal?
After every trading session, while it's fresh, including (especially) the bad days. Consistency matters more than perfection: a short journal kept every day beats a perfect one filled once a month.