
You are staring at a chart. Price just ripped higher in a near vertical move, almost violent. Then it cools off, it breathes, it carves out a small channel that drifts slightly against the trend. And right there you ask yourself: is this about to continue, or is it done? That is exactly the question the flag pattern is built to help you answer.
- Two parts: a pole (fast move, heavy volume) followed by a flag (channel consolidation, fading volume).
- Confirmation: a breakout of the channel in the direction of the original pole, ideally with volume picking back up.
- Price target: the pole's length projected from the breakout point.
- Two flavors: bull flag and bear flag, mirror images of the same logic.
The flag: a pause mid-sprint
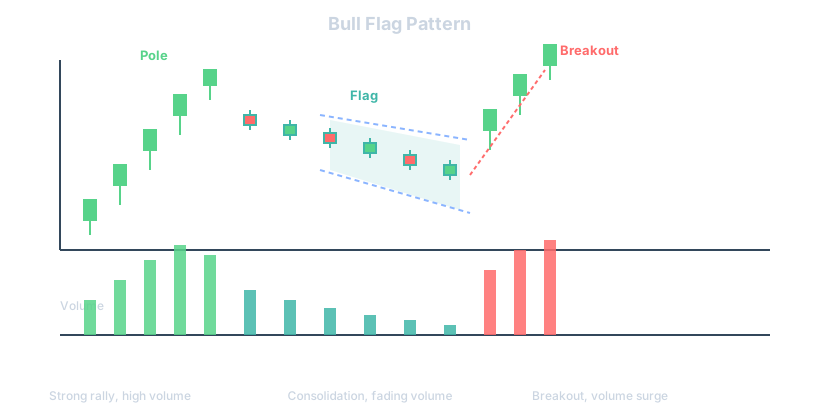
Picture a runner who sprints 200 meters flat out, then slows down to catch their breath before taking off again. That is roughly what price does when it builds a flag. The first phase, the pole, is the brutal effort: a string of candles shooting up (or down) almost vertically, carried by volume well above average. This is not a lazy trend grinding higher. It is an impulse, often triggered by news, a break of a major resistance level, or a sudden wave of institutional buyers (or sellers) stepping in.
Then comes the pause. Price does not collapse, nor does it immediately resume. It consolidates. And that consolidation has a specific shape, not just any shape. It sits inside a parallel channel, two roughly straight, parallel lines that tilt slightly against the direction of the initial move. After a sharp rally, the flag tilts downward. After a sharp drop, it tilts upward. That subtle counter-trend angle is what separates a flag from a plain sideways range.
Here is the detail most beginners skip: volume should shrink while the flag forms. Makes sense if you think about it. After the effort of the pole, the big players who pushed price are not dumping in a panic, they are letting the market digest the move. Light trading, little conviction either way. It is the calm before the next leg. If volume instead stays elevated or keeps climbing during the consolidation, be suspicious. That smells more like a reversal brewing than a technical breather.
Bull flag and bear flag: mirror setups
The bull flag shows up after a fast rally. The consolidation channel tilts slightly downward, as if the market were testing whether enough buyers remain willing to defend the levels. The expected breakout happens to the upside, through the top of the channel. This is the setup you hunt for in an established uptrend, usually after a clear catalyst: an earnings beat, a break of a long-standing resistance, favorable macro news.
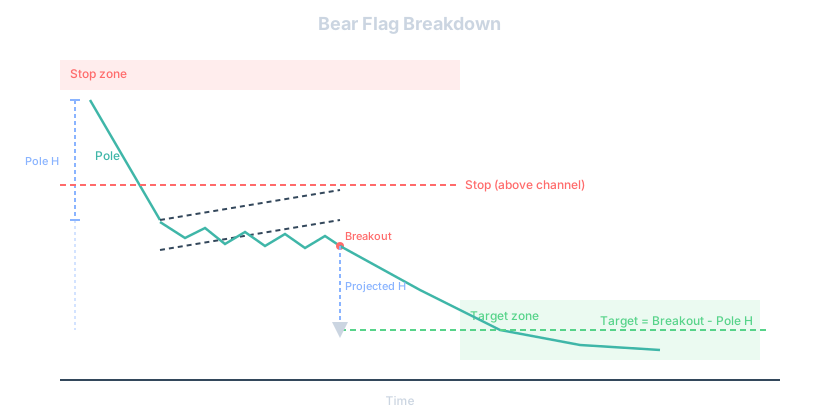
The bear flag is the mirrored image. After a vertical drop, price creeps back up a little inside a channel tilting upward. That bounce is not a reversal, it is a technical breather, often fueled by short-term sellers banking profits or by bargain hunters trying a counter-trend bet. The expected breakout happens to the downside, continuing the original drop. In crypto and forex alike, this pattern shows up constantly after a cascading liquidation followed by a small technical bounce, right before the downtrend takes back control.
One practical note: never confuse the flag with the pennant. The pennant shares the same pole-plus-pause structure, but its consolidation takes the shape of a tightening triangle instead of a parallel channel. Both patterns trade in a fairly similar way, but visually the geometry is different. Mixing the two up is not fatal, as long as you stick to the same breakout and risk rules.
Why this pattern works (and why it sometimes doesn't)
The logic behind the flag has nothing mystical about it. After a strong move, some participants cash out, that is normal and healthy. But if the underlying trend is still intact, traders who missed the initial move wait for a pause to get a better entry price. The flag is literally that queue forming. When it unlocks, often with a fresh catalyst or simply the exhaustion of short-term sellers, the move resumes in its original direction, carried by patient buyers plus a new wave jumping in on the breakout.
Still, let's be honest: no chart pattern wins every time. The flag fails, and it typically fails in two scenarios. First, when the initial move was itself a speculative blowoff with no real fundamentals behind it: the pole collapses and the flag turns into a top, not a pause. Second, when the broader market shifts regime during the consolidation, a macro announcement, a sentiment reversal, that kills the pole's momentum before the breakout even happens. That is exactly why you always trade a flag with a stop, never on blind conviction.
Spotting a genuine flag on your chart
In practice, here is what you need to check before telling yourself 'this is a flag':
- The pole has to be obvious at a glance, no need to zoom in and squint to imagine a fast move. If you have to force it, it probably isn't one.
- Volume on the pole must clearly exceed the recent average. A pole without a volume spike is suspicious.
- The pullback should stay contained, ideally no more than 50% of the pole's height. Beyond that, the pattern loses statistical strength.
- The channel should be drawable with two roughly parallel lines. If you have to twist the lines every which way to force a fit, it isn't a clean flag.
- Volume should shrink during the flag, then pick back up on the breakout.
Duration matters too. A flag that drags on for dozens of candles starts looking more like an ordinary range than a continuation pause. On short timeframes, a flag often lasts somewhere between 5 and 15 candles. On higher timeframes like the daily chart, the pause can stretch over several weeks without losing validity, as long as the channel stays clean and volume behaves consistently.
The entry mechanics
The basic rule: never enter while the flag is still forming, only on the breakout. Why? Because as long as price sits inside the channel, you don't yet know if this is a genuine continuation pause or the start of a reversal. Jumping in early means betting on an unconfirmed hypothesis, exactly the kind of bias that feeds FOMO when price eventually breaks out without you.
Two approaches exist in practice. The classic one: wait for a candle to close beyond the channel (above for a bull flag, below for a bear flag), ideally with volume higher than what was seen during the consolidation. The more aggressive one: enter the moment price touches the channel line intrabar, without waiting for the close. It gets you a better entry price but multiplies false signals, especially on volatile assets like crypto or small caps.
A purely illustrative example: imagine a stock climbing from 40 to 48 dollars in three days on heavy volume, that's the pole. It then consolidates between 45 and 47 dollars for five sessions, volume gradually fading, that's the flag. The day it closes above 47 with volume back above average, you have your breakout. The entry happens on that close, or on a quick pullback right after if price briefly retests the broken level before resuming.
Stop loss: where to place it without getting shaken out
Stop placement on a flag follows a simple logic: it sits on the opposite side of the channel from your entry direction. On a bull flag, the stop typically goes below the lower channel line, sometimes below the last swing low marked during the consolidation. On a bear flag, it's the reverse, the stop goes above the upper channel line.
The classic mistake is squeezing the stop too tight against the breakout line out of fear of risking too much. Result: a small retest wick triggers the stop before the move even really resumes. Some buffer is necessary, often sized off recent volatility (ATR, for instance), not off some arbitrary percentage picked at random. To dig deeper into stop placement in general, the piece on where to place your stop loss covers several methods that apply to any chart pattern, not just flags.
Calculating the price target
The flag's target calculation is one of the simplest in all of technical analysis, and that's probably why it's so widely used. You measure the pole's height, from the start of the fast move to its peak (or trough for a bear flag). Then you project that same distance from the flag's breakout point.
Back to the stock example: 40 dollars climbing to 48, an 8 dollar pole. If the flag breaks out at 47 dollars, the theoretical target sits at 47 + 8 = 55 dollars. It's not an exact science, price won't magically stop dead at that level, but it's a solid reference for setting a reasonable take-profit, or for judging whether the trade offers a decent risk-reward ratio before you even enter. Working that ratio out beforehand, not after the fact, is the foundation of serious risk management, a topic covered in detail in the risk-reward ratio explained simply.
Volume: the detail that separates a real flag from a fake one
If there's one thing that gets overlooked constantly, it's volume behavior across the whole pattern. A textbook flag has three distinct volume phases: a spike on the pole, a steady decline during the consolidation, and a renewed spike on the breakout. Skip any of these and the pattern gets shakier. A pole without volume confirmation might just be a random spike with no real buying or selling pressure behind it, the kind of move that reverses just as fast as it appeared.
A breakout without volume is arguably the bigger red flag. Price pokes above the channel, you get excited, you jump in, and then... nothing. No follow-through, no momentum, just a slow fade back into the range. That's a classic false breakout, and it happens more often than most traders admit. Checking volume isn't some optional nice-to-have, it's the difference between trading the pattern and gambling on a shape you saw on a chart.
Flags inside the bigger trend picture
A flag never trades in isolation. Context matters enormously. A bull flag that forms during a strong, established uptrend, think a stock making new highs for weeks, carries far more weight than a bull flag popping up in a choppy, directionless market. The pattern is a continuation signal, so it needs something to continue. No clear trend, no real edge.
This is where a lot of swing trading approaches lean on moving averages or prior structure to confirm the broader direction before even looking for a flag. If the 50-period moving average is sloping up and price keeps bouncing off it, a bull flag forming above that average is a much higher quality setup than one forming below it, fighting the trend. Always zoom out before you zoom in.
Common mistakes traders make with flags
The most frequent error is forcing the pattern onto a chart that doesn't really show one. You want a flag so badly, maybe because you missed the initial pole, that you start seeing channels where there's only noise. Three or four random candles become a flag in your mind. That's wishful thinking, not analysis, and it usually ends with a trade based on a shape that was never really there.
Another mistake: ignoring the retracement depth. If the so-called flag retraces 70 or 80 percent of the pole, you're not looking at a healthy pause anymore, you're looking at a potential reversal wearing a flag costume. And then there's the sizing problem: traders go all in on the breakout because the pattern 'looks so clean', skipping any real position sizing discipline. A pattern, however textbook, is still just a probability, never a certainty.
How Tradoshi helps you
Spotting a flag is only half the job. The other half is knowing whether trading flags actually makes you money over time, and that's where most traders fly blind. Tradoshi's trading journal lets you import your trades automatically from MT5, MT4, cTrader or your crypto exchange, or log them manually, and then tag each one with a free label you choose yourself, something as simple as 'bull flag' or 'bear flag breakout'. Over a few months, you can filter your history by that label and see your real win rate, profit factor and average win/loss ratio on that specific setup, not a vague feeling.
Before you even click buy, the position size calculator and your own custom risk rules help you keep the percent of capital risked per trade consistent, whether you're trading a flag on a large cap stock or a volatile altcoin. And when a flag trade doesn't play out as expected, the Trade Review feature lets you replay it, add notes on what you saw, and check your plan adherence: did you actually wait for the breakout close, or did you jump the gun because the chart looked tempting? Over time, that honest feedback loop, backed by your Discipline score, is what separates traders who think they trade flags well from traders who actually do.
Putting it all together on a real setup
Let's walk through a fuller illustrative scenario. Say EUR/USD rallies from 1.0800 to 1.0880 over six hours on a strong employment report, that's your pole, 80 pips, with volume (or tick volume, if you're on forex) clearly elevated. Over the next ten hours, price drifts between 1.0845 and 1.0865, forming a tidy little downward-tilting channel, volume fading with each hour. That's your flag.
Price closes above 1.0865 on renewed volume. You enter there, or on a small pullback to 1.0862 if one occurs. Your stop sits just below 1.0845, below the channel's lower line, giving you roughly 20 pips of risk. Your target: 1.0865 + 80 pips = 1.1145, projecting the full pole height. That's a 4:1 reward-to-risk setup on paper. Whether price actually reaches it is another story, markets don't owe you anything, but the structure gives you a defined plan instead of a guess.
Frequently asked questions
What is the difference between a flag and a pennant?
Both share the pole-plus-pause structure, but a flag consolidates in a parallel channel while a pennant consolidates in a converging, narrowing triangle. The trading rules are nearly identical for both.
How long should a flag pattern last?
There's no fixed rule, but on shorter timeframes a flag often lasts 5 to 15 candles. On daily charts it can stretch over several weeks and still be valid, as long as the channel and volume behavior stay consistent.
Can a flag pattern fail?
Yes, regularly. It can fail if the initial pole was a speculative spike with no real backing, or if broader market conditions shift during the consolidation. That's exactly why a stop loss is non-negotiable on this setup.
Does the flag pattern work on all timeframes?
It shows up on everything from one-minute charts to weekly charts. The underlying logic doesn't change, though lower timeframes tend to produce more false breakouts, so extra volume confirmation matters more there.
How do I calculate the price target of a flag?
Measure the height of the pole, from the start of the sharp move to its extreme point, then project that same distance from the breakout point of the flag in the direction of the original move.
Is volume really necessary to validate a flag?
It's not strictly mandatory, but it's the single best filter against false signals. A pole without a volume spike, or a breakout without one, should make you more cautious before committing.
What's the best way to place a stop loss on a flag?
Place it just beyond the opposite side of the channel from your entry, with enough buffer based on recent volatility so a normal retest wick doesn't trigger it prematurely.
Can the flag pattern appear in a downtrend?
Yes, that's the bear flag: a sharp drop (the pole) followed by a slight upward-drifting consolidation (the flag), then a breakdown continuing the original decline.
Should I trade every flag I see on a chart?
No. Quality matters more than quantity here. A flag forming against the dominant trend, with weak volume or an oversized retracement, is a weaker signal than a textbook setup aligned with the broader trend.