
Three lines dancing on a sub-chart, a channel that breathes wider or tighter, and one number that decides everything: 50. The Traders Dynamic Index claims to pack trend, momentum and volatility into a single glance. Let's see if it actually delivers, and more importantly how to use it without getting faked out.
- The TDI stacks three building blocks: a smoothed RSI, a signal line, and volatility bands forming a channel around a 50 midline.
- Reading it means combining three signals: the RSI/signal crossover, the position relative to 50, and the width of the volatility channel.
- It's a momentum tool, not a crystal ball: it lags at times and throws plenty of false signals inside a range.
- Paired with a written risk plan and disciplined trade tracking, it turns into something usable instead of just another squiggly line on your chart.
What the Traders Dynamic Index actually is
The Traders Dynamic Index, everyone just calls it TDI, is a composite indicator. That means it doesn't measure one single thing, it stacks several calculations on the same window: a reworked RSI, a moving average of that RSI, and volatility bands wrapped around both. Visually you get a separate panel below your price chart, with three to five lines oscillating between 0 and 100.
The whole point of the tool is to hand you, in one look, what you'd normally have to pull from three separate indicators. Trend? Check the green line against 50. Momentum picking up or fading? Watch the crossover between the green and red lines. Is the market getting more volatile or quieter? Look at whether the channel is expanding or squeezing shut. On paper, that's clever design. In practice, it takes a bit of screen time before your eye learns to sort the signal from the noise.
It's not a trend indicator in the classic sense, like a 200-period moving average. It's closer to a momentum gauge dressed up with volatility context. It tells you where the market's dynamic stands right now, not where price will be in three days. A lot of beginners miss that distinction and end up expecting the traders dynamic index to forecast something it never promised.
Where the TDI came from and who built it
The origin story is a bit hazy, which is typical of indicators born on forex trading forums back in the 2000s. It's generally credited to a trader going by the name Dean Malone, sometimes referenced as Dean Trader. No official biography, no published academic paper, just a free indicator shared on MetaTrader that eventually became a scalping classic.
That kind of informal origin shows up in plenty of popular retail trading tools. Unlike Wilder's RSI or Appel's MACD, both documented in reference books, the TDI grew out of the community, got tweaked across dozens of shared code versions, and never settled into one single fixed definition. You'll find slightly different variants depending on where you download it, with minor differences in colors or default parameters.
That fuzziness doesn't make it useless. Plenty of solid trading tools come from practitioners rather than researchers. But it does mean one thing: never take an indicator at face value just because it looks sophisticated with its three lines and its channel. Test it yourself, measure what it actually gives you on your market.
The TDI's components, one by one
To really understand the TDI, you need to break down each piece separately. Otherwise you're staring at a colorful plate of spaghetti with no idea what to eat first.
The smoothed RSI line (green)
This is the engine of the whole thing. A standard RSI, typically calculated over 13 periods by default, then smoothed with a short simple moving average, often 2 periods. That smoothing makes the line less jittery than a raw RSI, easier to read visually. It still oscillates between 0 and 100, same as any standard RSI.
The signal line (red)
This is a slower moving average of that same RSI, typically 7 periods. Its role mirrors the signal line in a MACD setup: when the fast green line crosses above the slower red one, you get a potential bullish signal. Below, a potential bearish one. This is usually the first thing beginners learn to spot on the panel.
The midline (yellow or gray, at 50)
It represents the average of the two volatility bands and mainly serves as a visual anchor around the 50 level. When the green RSI sits above this midline, the bias leans bullish. Below it, bearish. Nothing exotic here, it's the same logic as a classic RSI where 50 marks the border between bullish and bearish strength.
The volatility bands (usually light red, forming a channel)
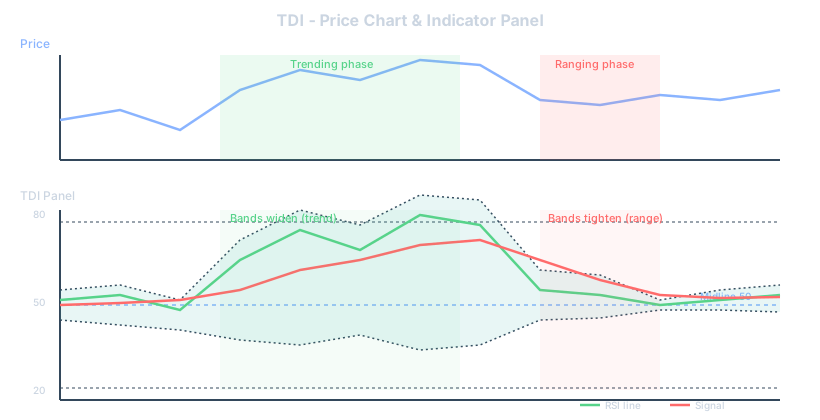
These are two envelopes calculated from the standard deviation of the RSI over a given period, typically 34 by default. They form a channel that widens when momentum volatility increases, and tightens when the market goes quiet. It's basically the RSI equivalent of what Bollinger Bands do to raw price. If you want to push that parallel further with price action itself, it's worth comparing it to how supply and demand zones work, which offer a different lens on the same idea of pressure shifting at specific levels.
The formula and default settings
Here are the standard settings you'll find in most TDI versions available for MT4 and MT5. These aren't carved in stone, but they're the historical starting point and the most widely used configuration.
| Parameter | Default value | Role |
|---|---|---|
| RSI period | 13 | Base momentum calculation |
| Fast line smoothing (green) | 2 | Makes the RSI more readable |
| Signal line period (red) | 7 | Detects momentum shifts |
| Volatility bands period | 34 | Calculates RSI standard deviation |
| Midline level | 50 | Separates bullish and bearish bias |
| Extreme zones (optional) | 68 / 32 | Overbought/oversold markers adapted for TDI |
Notice that the TDI's extreme zones (often 68 and 32) deliberately differ from the classic 70/30 levels of a standard RSI. Some traders ignore them entirely and focus only on crossovers and position relative to 50. Others use them as an extra filter to avoid entering right into an overbought zone. Both approaches hold up fine, as long as you stay consistent trade after trade instead of switching the rule depending on your mood that day.
How to actually read the TDI
Three readings combine here, and it's exactly that layering which gives the indicator its strength, and its complexity.
1. The RSI / signal line crossover
When the green line crosses above the red one, you get a potential buy signal. The reverse gives a potential sell signal. Picture EUR/USD stuck in a tight range: the green line has been oscillating under the red one for twenty candles, then it crosses decisively above it right as price breaks a horizontal resistance. That's exactly the kind of confluence scalpers hunt for with the traders dynamic index.
2. Position relative to 50
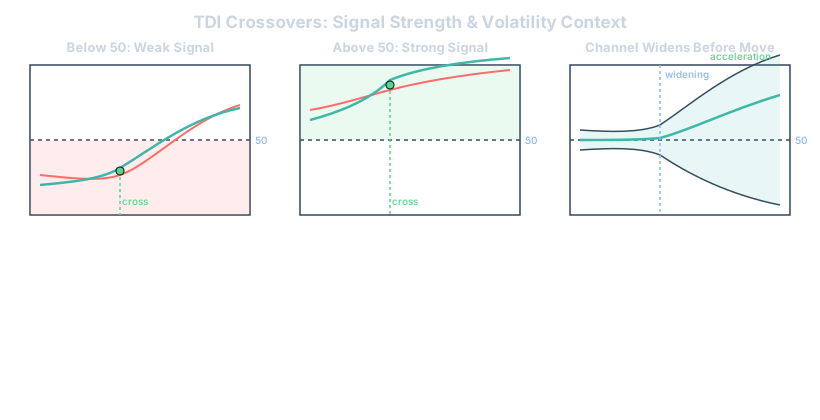
A bullish crossover that happens above 50 is generally considered more reliable than one that happens below it. Why? Because it means the overall momentum is already leaning bullish, the crossover is just confirming a dynamic that's already in motion. A bullish crossover under 50, on the other hand, looks more like a technical bounce inside a downtrend than a genuine reversal. A lot of beginners skip this nuance and take every crossover unfiltered, with predictable results.
3. The width of the volatility channel
A wide channel signals a nervous, momentum-driven trend with real participation. A narrow channel signals a sleepy market, often ranging, where crossovers are far more likely to be false signals. Some traders explicitly wait for the channel to widen before trusting any crossover. It's a simple way to filter out a good chunk of the noise without overcomplicating your system.
Trading strategies built around the TDI
The TDI made its name mostly in forex scalping and day trading, on short timeframes like M5 or M15. Here are the most common approaches, adapt them to your own style and market.
- Filtered crossover scalping: you only enter on a RSI/signal crossover that happens on the right side of 50, with a volatility channel that's actively widening. Tight stop, quick exit once the green line crosses back the other way.
- On longer timeframes like H1 or H4, some day traders wait for price to test a structure level (support, resistance, moving average) at the same time as a TDI crossover in the same direction, which cuts down trade frequency but raises selectivity.
- In trend trading, you ignore minor crossovers and instead watch whether the RSI stays persistently above (or below) 50 without ever fully retracing across it, a sign of a strong trend where you're hunting re-entries rather than reversals.
- A defensive variant is exiting a trade as soon as the volatility channel sharply tightens after an expansion phase, which often signals fading momentum before the opposite crossover even shows up.
Whichever variant you pick, the common thread among traders who stick with the TDI long-term is that they fold it into a written system with clear entry, exit and position sizing rules. Without that, you're improvising candle by candle, and the indicator turns into an excuse to react emotionally rather than a decision-making tool. That's exactly the kind of drift that a proper trading playbook is meant to prevent, by documenting which setups actually work for you instead of chasing every signal the panel throws out.
Combining the TDI with other indicators
The TDI rarely works best alone, and most experienced users treat it as a confirmation layer rather than a standalone system. Pairing it with a simple moving average on the price chart, for instance, gives you a trend filter: you only take TDI crossovers that align with the direction of a 50 or 200-period average. That single rule alone kills a large share of the counter-trend false signals that plague the indicator in choppy conditions.
Some traders also stack it against a MACD, checking whether both tools point the same direction before pulling the trigger. It sounds redundant since both derive from momentum logic, but a MACD calculated on price and a TDI calculated on RSI don't always agree, and that disagreement itself is informative: it often flags a market that's indecisive rather than genuinely trending. If you're more of a pure price action trader, you can still use the TDI as a secondary filter, entering only when a candlestick rejection at a key level coincides with a TDI crossover, which anchors the signal in something the market actually printed rather than just an oscillator reading.
Whatever combination you land on, write it down. Vague plans like 'I use TDI with some other stuff' collapse the first time you're staring at a live chart with money on the line. A concrete trading journal entry describing exactly which confluence you required, and whether it actually held up, teaches you more in three months than reading ten more articles about indicator combos.
Downloading and installing the TDI on MT4 or MT5
The TDI doesn't come pre-installed on MetaTrader by default, so you'll need to add it as a custom indicator. It's freely available on most trading forums and MQL community sites, distributed as a .mq4 or .mq5 file. Installation follows the same routine as any custom indicator: drop the file into the MQL4 or MQL5 'Indicators' folder inside your terminal's data directory, restart the platform, then find it under 'Custom Indicators' in your navigator panel.
Once it's installed, you'll typically get a settings window letting you adjust the RSI period, the smoothing values, and the volatility band period, along with color options for each line. A word of caution here: because the TDI comes from community-shared code rather than one official source, quality varies between versions. Some have bugs, some repaint on lower timeframes, meaning past signals can visually shift after the fact, which is obviously a problem if you're backtesting. Always test a fresh download on a demo account for a few sessions before trusting it with real capital.
Limits and false signals of the TDI
No indicator escapes this section, and the TDI is no exception. Its biggest weakness shows up in ranging markets, where price oscillates without commitment and the RSI keeps flipping around 50. In that environment you'll see crossover after crossover, most of them meaningless, and if you trade every single one you'll bleed small losses through spread and slippage alone. This is a textbook trigger for overtrading, where an indicator that looks busy convinces you the market is offering more opportunities than it really is.
There's also a lag problem baked into any RSI-based tool. Because the lines are smoothed averages of an already-lagging oscillator, the TDI reacts to price, it doesn't predict it. By the time a crossover confirms, part of the move has often already happened. That's not necessarily fatal, plenty of trend-following systems accept lag as the price of filtering noise, but you need to know that going in rather than expecting the TDI to catch tops and bottoms with precision.
Finally, watch out for signal clustering around big news events. A sudden volatility spike can blow the channel wide open and trigger a crossover that has nothing to do with genuine momentum shift, just a reaction to a headline. The TDI itself has no way of knowing a news release is happening, it just reads price-derived RSI values, so the responsibility to filter that context sits entirely on you.
TDI vs classic RSI vs Stochastic
It helps to place the TDI next to the two indicators it clearly borrows from. A classic RSI gives you one line and two static thresholds, usually 70 and 30. It's simple, well documented, and doesn't drift much between platforms. The TDI takes that same RSI, smooths it, adds a signal line and wraps volatility bands around it, essentially trying to answer three questions where the plain RSI only answers one.
The Stochastic oscillator, meanwhile, measures something structurally different: where the current close sits relative to the recent high-low range, not the RSI's average gain versus average loss. Traders often confuse the two because both oscillate between 0 and 100 and both use a signal line for crossovers. But a Stochastic tends to react faster and whipsaw more in ranges, while the TDI's extra smoothing layer trades some of that speed for readability. Neither is objectively better, they just suit different holding periods and different tolerance for noise.
| Indicator | What it measures | Best fit |
|---|---|---|
| Classic RSI | Average gain vs average loss over N periods | Simple momentum reads, swing trading |
| Stochastic | Close position within recent high-low range | Fast reversals, range-bound markets |
| TDI | Smoothed RSI + signal line + volatility bands | Composite reads for scalping and day trading |
How Tradoshi helps you
An indicator like the TDI only earns its place on your chart if you can prove, with your own numbers, that it actually improves your results. That's where a structured trading journal changes the conversation: instead of feeling like the TDI 'works', you import your trades from MT4, MT5, cTrader or a crypto exchange, or log them manually, and you check your win rate, profit factor, expectancy and Oshi Score on the trades where you actually used a TDI-based setup versus the ones where you didn't.
Tradoshi also lets you tag each trade with your own free labels, note plan adherence, and record an emotional check-in before you pull the trigger. If you decide TDI crossovers above 50 are your edge, you can label exactly that, then later review whether you stuck to the rule or jumped in on a random crossover out of impatience. The discipline score tracks how consistently you follow your own stated rules, which matters more than the indicator itself: a mediocre setup traded with iron discipline usually beats a great setup traded on impulse.
On the risk side, the position size calculator and customizable risk rules help you keep every TDI-based trade within a fixed percentage of your capital, so a string of false signals in a range doesn't turn into a blown account. And when a trade goes wrong, the trade replay and debrief tools let you rewatch the setup with your own notes attached, which is usually where you spot that the channel was actually tightening the whole time, a detail you missed live but won't miss twice.
Frequently asked questions about the TDI
Frequently asked questions
What does TDI stand for in trading?
TDI stands for Traders Dynamic Index, a composite momentum indicator combining a smoothed RSI, a signal line, and volatility bands, mainly used on MetaTrader platforms.
Who created the Traders Dynamic Index?
It's generally credited to a trader known as Dean Malone, sometimes referred to as Dean Trader, who shared it on forex forums in the 2000s. There's no official documentation confirming his identity beyond that.
Is the TDI good for scalping?
Yes, it's widely used for scalping on short timeframes like M5 and M15 because it combines momentum and volatility context in one panel, though false signals increase sharply in ranging conditions.
What are the default TDI settings?
Most versions use a 13-period RSI, a 2-period smoothing for the fast line, a 7-period signal line, and a 34-period volatility band, with a midline fixed at 50.
How do you read a TDI crossover?
A bullish signal happens when the green RSI line crosses above the red signal line, ideally above the 50 midline. A bearish signal is the mirror case, ideally below 50.
Is the TDI better than the classic RSI?
It's not strictly better, it's more layered. The classic RSI is simpler and more standardized, while the TDI adds a signal line and volatility bands for a richer but more complex read.
Can the TDI be used on MT5 as well as MT4?
Yes, versions exist for both platforms, typically distributed as .mq4 or .mq5 custom indicator files that you install manually through the platform's data folder.
Does the TDI work on all markets or just forex?
It's most popular in forex because of its scalping origins, but it can be applied to indices, crypto or commodities. Results depend heavily on the market's typical volatility profile.
What is the main weakness of the TDI?
Its biggest weakness is generating frequent false signals inside ranging or low-volatility markets, since crossovers around 50 multiply without any real directional follow-through.
Should the TDI be used alone?
Most experienced traders avoid using it alone and combine it with a trend filter like a moving average, price action confirmation, or market structure analysis to reduce false signals.