 By Benjamin Roure L'Hermitte

A crypto trading journal is the record of your cryptocurrency trades, kept with the fields this market adds to the usual ones: the platform, the position type, the leverage, the fees and the funding. Because crypto never closes. No opening bell, no closing bell, no weekend to catch your breath. That continuity changes everything about how you should keep your journal, because notions that feel universal in trading, like 'today's session' or 'the cost of the position', take on a completely different meaning on a market that runs 24 hours a day, 7 days a week. A journal built for stocks or forex misses the essentials in crypto.
- 24/7 dissolves the notion of a 'day': you need your own session definition to compare trades against each other.
- The funding rate on perpetuals is a hidden cost or gain that doesn't show up in the entry and exit price.
- Exchange risk (blocked withdrawals, a struggling platform) is a factor in its own right, not a technicality.
- Extreme volatility distorts raw P&L: the R-multiple reveals your edge, the euro or dollar amount hides it.
The reflex, when you come to crypto, is to reuse the journal format of stocks or forex: date, instrument, entry, exit, result. That format works, but it misses several mechanics specific to crypto that, if not tracked, skew the reading of your performance. Funding, exchange, leverage and the very notion of a trading 'day' deserve specific treatment. If these mechanics are still new to you, the basics of crypto trading go through them one by one.
This guide details what a crypto trading journal needs to track in addition to (or differently from) a classic journal, why these elements concretely matter for your edge, and how Tradoshi automatically captures much of this specificity through exchange sync.
24/7 dissolves the notion of a 'day'
In stocks, a trading day has clear boundaries: Wall Street's core session runs from 9:30 a.m. to 4:00 p.m. New York time (NYSE trading hours). Crypto has none of that: these markets are open 24 hours a day, seven days a week, as Hansen, Kim and Kimbrough point out. A trade can open on a Monday at 11pm and close on Tuesday at 4am, with no natural notion of a 'day' to segment that activity. You then end up with a journal where the very concept of 'today's performance' no longer has a clear meaning.
The solution isn't to give up on segmenting, but to define your own windows, for example a 24-hour cycle set on your own timezone or on your actual active trading hours, rather than trying to artificially force a stock-market rhythm onto a market that has none. This definition needs to stay fixed over time so your statistics remain comparable from one week to the next, otherwise you're comparing different windows without realizing it.
Funding rate, a cost or a gain you can't see in the price
If you trade perpetuals (crypto futures with no expiry), the funding rate is a payment between traders that keeps the contract price aligned with the spot price of the underlying: when the rate is positive, long positions pay short positions, and the reverse when it is negative (Kraken's perpetual contract specifications). The schedule depends on the platform: Kraken settles it every hour, and Hansen, Kim and Kimbrough noted in 2021 funding times at 00:00, 08:00 and 16:00 UTC on Binance. Concretely, holding a long or short position for several hours or days makes you pay or receive funding, independently of the price move itself.
That amount is settled at each funding time and accumulates on positions held for a while: on a strategy that holds positions for several days, it can weigh on a trade's net result. A journal that doesn't separate price P&L from accumulated funding gives you a distorted picture: a trade that looks winning on price can be neutral or losing once funding paid is subtracted, and conversely, a position that looks mediocre on price can have been made profitable by favorable funding.
Exchange risk, a risk factor in its own right
In the European Union, the rules covering traditional investment services require investment firms to belong to an investor compensation scheme, which steps in for instance if one of them goes bankrupt and cannot return its clients' securities. The MiCA regulation, which governs crypto-assets, provides nothing comparable: if your platform is unable to return your crypto-assets, there is no safety net, warns ESMA in its warning on crypto-assets, published in late 2024. It has already happened: in November 2022, the FTX platform collapsed following a run sparked by concerns about its liquidity and solvency, then filed for bankruptcy, as the Bank for International Settlements reports. This risk doesn't show up anywhere on a price chart, but it's an integral part of your overall risk management.
| Factor | Why track it |
|---|---|
| Split across exchanges | Avoid concentrating all your capital on a single platform |
| Idle funds vs funds in position | Idle capital still sits exposed to platform risk |
| Exchange reliability track record | Longevity, known incidents, reputation |
| Frequency of withdrawals to your own wallet | Reduce prolonged exposure on the exchange |
Tracking where your capital sits, not just how much you have, is part of a serious crypto journal. A trader who only logs trades and never looks at their split across platforms risks discovering, on the day it matters, that they had far more capital exposed on a single exchange than they thought.
Spot, futures and leverage: separate lines
Crypto lets you trade the same pair as spot (you actually own the asset) or as leveraged futures (you control a larger exposure than your margin deposit). These two ways of trading have neither the same risk profile nor the same mechanics: in futures, the position is liquidated as soon as the account value falls below the maintenance margin (Kraken's liquidation FAQ), which does not happen to an asset bought outright without borrowing. Mixing them in the same journal without distinction makes analysis unreadable.
A useful crypto journal clearly separates the position type (spot or futures), the leverage used if any, and the exchange involved. This granularity lets you answer concrete questions: is your edge better in spot than in futures? Does your win rate drop past a certain leverage level? Without these distinct fields, these questions stay unanswered, drowned in a global P&L that mixes different mechanics.
Extreme volatility distorts raw P&L
Crypto-asset prices are subject to sudden and extreme fluctuations, also overnight, writes ESMA, and the European Central Bank noted in May 2022 that their historical volatility dwarfs that of European equity and bond markets. That volatility makes raw euro or dollar P&L particularly misleading for judging the quality of your decision-making, because the same amount won or lost can correspond to very different levels of risk taken from one trade to the next.
The R-multiple, a notion the Van Tharp Institute defines by relating every profit and loss to the initial risk accepted, corrects that bias. A trade that returns 200 having risked 50 (an R-multiple of +4) pays better for the risk taken than one that returns 500 having risked 400 (an R-multiple of +1.25), even though the second looks more impressive in absolute value. In crypto, where amounts can swing wildly from trade to trade because of leverage and volatility, this normalization through the R-multiple isn't an optional refinement: it is what lets you see whether your edge actually exists.
Fees, heavier than they look
Crypto transaction fees depend on your role in the trade: you are a maker when your order first sits in the order book before it is matched, a taker when it crosses the book and is matched immediately (Kraken's derivatives fee schedule). They also depend on the platform and on your activity: on Kraken spot, read in October 2026, they range from -0.02% (maker) to 0.80% (taker) of the order value, depending on your 30-day volume and the pair traded (Kraken's help page on trading fees). On a strategy that trades frequently, these fees pile up and can turn an edge that looks positive on paper into a neutral or negative result once real costs are factored in.
A journal that captures the actual fees paid on each trade, rather than ignoring or roughly estimating them, lets you check whether your trading frequency remains compatible with your edge. That's a particularly critical point for high-frequency or scalping strategies in crypto, where fees can represent a significant share of the gross result.
Liquidity, very uneven between large caps and altcoins
The crypto market includes a handful of highly liquid assets, with a deep order book and a tight spread, and a crowd of much thinner altcoins, where even a modest position can move the price or suffer significant slippage between the intended price and the price actually obtained. On Binance, from May to December 2023, ESMA measures extremely low bid-ask spreads on Bitcoin and Ether, and on all the other assets compared significantly lower volumes and more sizeable spreads, hence markedly higher implicit trading costs. This liquidity difference never shows up on a price chart alone, but it concretely changes the real cost of every trade.
A crypto journal benefits from logging the liquidity category of the asset traded, to check whether part of the underperformance on altcoins comes from poorly anticipated execution cost rather than an analysis error. The European Supervisory Authorities name this risk: crypto-asset markets may experience liquidity constraints, which could limit your ability to sell at the price or time you want (joint warning of the European Supervisory Authorities, 2025 version).
How Tradoshi helps with your crypto journal
Tradoshi connects directly to 9 major crypto exchanges (Kraken, Bitget, Binance, Coinbase, Bybit, OKX, KuCoin, MEXC, Gate.io) and automatically applies the correct calculation logic depending on position type: FIFO for spot, netting for futures. Every synced trade arrives already correctly calculated, without you having to manually reconstruct the P&L of a chain of partial fills.
- Automatic sync of 9 crypto exchanges, spot and futures, read-only.
- Spot FIFO and futures netting logic applied automatically, no manual calculation.
- R-multiple and expectancy computed to read your edge independently of market volatility.
- Universal CSV import for exchanges not natively connected.
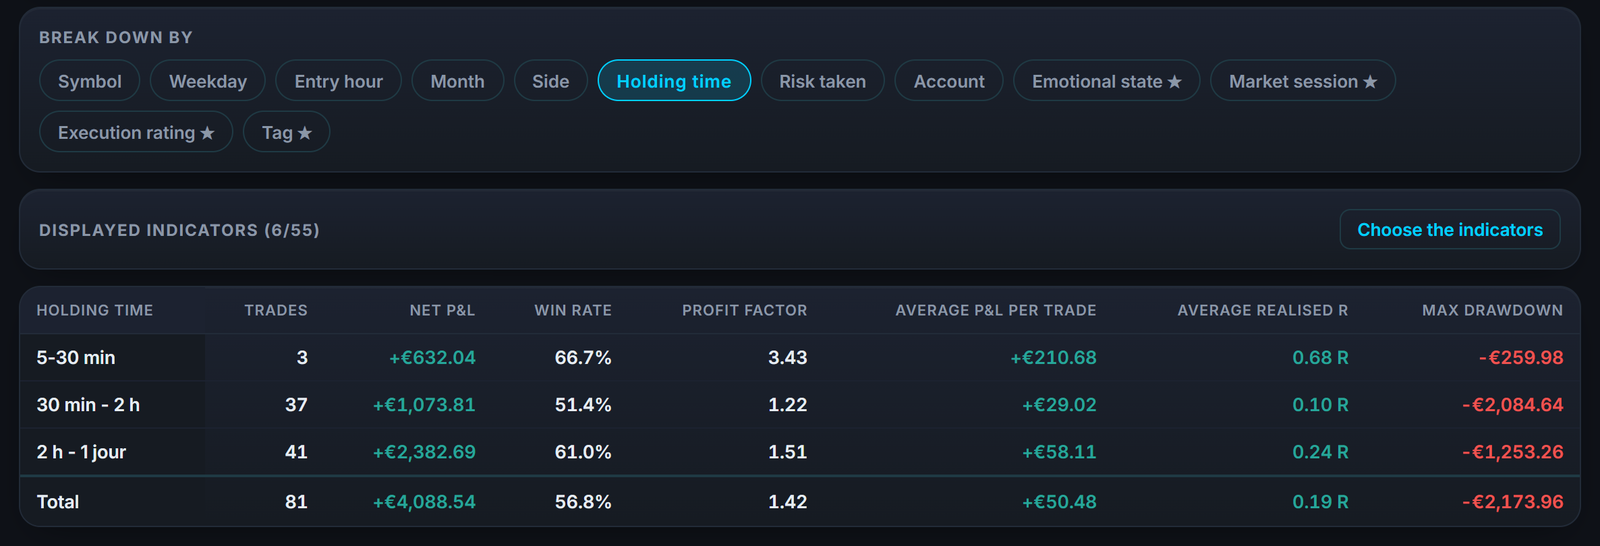
One last point, worth stating plainly: a trading journal tracks what you did, never what you hold. Crypto sitting in cold storage or on an exchange without being traded does not belong in the journal, it belongs in portfolio tracking, which answers a different question: what your holdings are worth, what they cost you, and what is carrying the result. That is the job of Tradoshi's crypto portfolio tracker, free on every plan and needing no imported statement. Cost basis has traps of its own, detailed in our article on crypto cost basis.
Frequently asked questions
Why should a crypto journal differ from a stock or forex journal?
Because crypto runs 24/7 (no natural notion of a day), includes specific mechanics like the funding rate on perpetuals, carries real exchange risk, and shows extreme volatility that distorts raw P&L. A classic journal misses these elements.
What is the funding rate and why track it?
It's a mechanism that, on perpetuals, periodically makes one side of the market pay or receive based on the gap with the spot price. Holding a position for a while makes you pay or receive funding independently of the price move. Without tracking it separately, a trade can wrongly look winning or losing once that amount is subtracted or added.
How do I segment my trading days in crypto?
Define your own fixed window (for example 24 hours set on your own timezone) rather than forcing a stock-market rhythm onto a market that has none. What matters is that this definition stays constant over time so your statistics remain comparable.
Why does the R-multiple matter more than euro or dollar P&L in crypto?
Because crypto's extreme volatility means the same amount won or lost can correspond to very different levels of risk taken from one trade to the next, especially with leverage. The R-multiple relates the result to the initial risk taken, revealing your real edge where the absolute amount can mislead.
Should I separate spot and futures in my journal?
Yes. They have neither the same risk profile nor the same mechanics (liquidation in futures). Mixing them makes it impossible to answer simple questions like whether your edge is better in spot or futures, or whether your win rate drops past a certain leverage level.
How does Tradoshi handle crypto spot and futures?
Tradoshi connects to 9 major crypto exchanges read-only and automatically applies FIFO logic for spot and netting for futures, without you needing to manually recompute the result of a chain of partial fills.
Why track the liquidity of crypto assets traded?
Because it varies enormously between highly liquid large caps and thinner altcoins, where even a modest position can suffer significant slippage. Logging the liquidity category helps distinguish underperformance due to execution from underperformance due to analysis.
Does the stablecoin used to trade matter enough to track?
Yes, to some extent. Holding capital in a stablecoin between trades isn't entirely neutral: it stays exposed to the risk of the exchange holding it, and to a risk specific to the stablecoin itself. After the TerraUSD crash and the Tether de-peg, the European Central Bank wrote in May 2022 that stablecoins are not as stable as their name suggests. Tracking where and in what form your idle capital sits rounds out your overall risk picture, beyond just your trades' results.
Should I track withdrawal fees to a personal wallet?
It's useful, even though these are rarely amounts that change a strategy. A trader who regularly withdraws to a personal wallet to reduce exchange exposure pays for that choice in recurring fees. Tracking this cost over time lets you check it stays proportionate to the risk reduction it brings, rather than ignoring it out of habit.
Does it matter whether I trade during a bull or bear market cycle?
It can. Crypto has already been through extended bull and bear phases, and a strategy that performs well in one regime doesn't automatically perform the same way in the other. Tagging the broad market cycle context, even loosely, lets you check whether your edge is genuinely robust or mostly tied to one type of environment.