
Profit factor is one of the simplest ways to judge whether a trading strategy is producing more money from winners than it gives back through losers. It is not a complete performance review by itself, but it gives traders a quick, practical read on whether a system has a real edge after losses are counted. Used correctly, trading profit factor can help you compare setups, refine risk rules, and avoid being misled by win rate alone.
What is profit factor in trading?
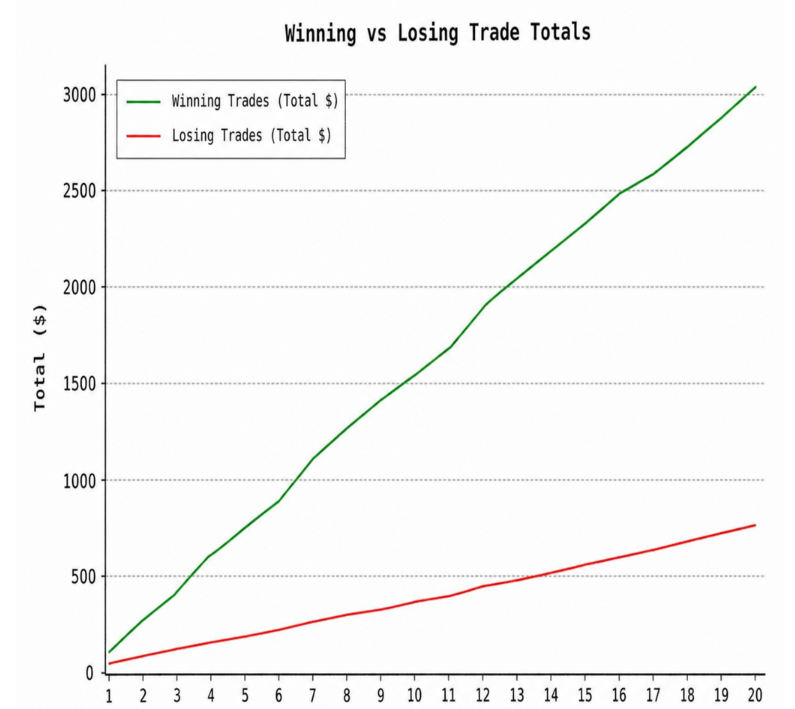
Profit factor in trading is the ratio between the total profit from winning trades and the total loss from losing trades. In plain terms, it answers this question: for every dollar the strategy loses, how many dollars does it make back from winning trades? A profit factor above 1.0 means the strategy made more than it lost before any additional interpretation; a value below 1.0 means the strategy lost money.
The basic profit factor definition is intentionally straightforward. If your winning trades added up to more than your losing trades, the ratio rises above 1. If losing trades were larger than winners in total, the ratio falls below 1. This makes profit factor trading analysis especially useful when you want a clean first look at strategy quality.
However, simple does not mean foolproof. A strategy can show a strong profit factor over a tiny sample and still fail in live markets. Another strategy may show a modest profit factor but generate many repeatable trades with controlled risk. That is why profit factor should start your analysis, not end it.
The profit factor formula and a simple example
The profit factor formula is:
Profit Factor = Gross Profit ÷ Gross Loss
Gross profit is the sum of all winning trades. Gross loss is the absolute value of all losing trades, meaning you use the positive total of the losses rather than a negative number. This is the standard way to calculate profit factor because the result should be an easy-to-read ratio.
For example, imagine a strategy with:
- Total winning trades: $8,500
- Total losing trades: $5,200
- Profit factor: $8,500 ÷ $5,200 = 1.63
A trading profit factor of 1.63 means the strategy generated $1.63 in gross profit for every $1.00 it lost. That is usually a healthy sign, especially if the sample includes enough trades and realistic costs. But if that result came from only eight trades, it is still too early to trust it. If it came from 150 trades across different market conditions, it carries much more weight.
When traders ask, “what is the profit factor in trading?” they are often really asking whether this number can tell them if a strategy is worth keeping. The answer is yes, but only when the calculation includes every trade, realistic costs, and enough data to reduce luck.
What profit factor is good in trading?
A good profit factor in trading depends on the strategy type, trade frequency, market conditions, and sample size. As a rough guide, anything below 1.0 is losing, 1.0 to 1.2 is fragile, 1.2 to 1.5 may be workable for high-frequency approaches, 1.5 to 2.0 is generally strong, and values above 2.5 should be reviewed carefully for sample-size issues or overfitting.
There is no universal answer to what is considered a good profit factor in trading because different strategies produce different trade distributions. A scalping system may take many trades with smaller average gains, so a profit factor around 1.3 can be meaningful if costs are controlled. A swing strategy may trade less often, so it often needs a higher profit factor to compensate for fewer opportunities and longer holding periods.
Use these ranges as practical context, not rigid rules:
- Below 1.0: The strategy is losing. Review entries, exits, stop placement, position sizing, and whether the market condition still fits the setup.
- 1.0 to 1.2: The strategy is near breakeven. After commissions, spreads, slippage, and mistakes, it may not be viable.
- 1.2 to 1.5: The strategy may have a real edge, especially if it trades frequently and keeps costs low.
- 1.5 to 2.0: This is often a strong range when supported by a meaningful sample and consistent execution.
- 2.0 to 2.5: This can be excellent, but the trader should check whether the result depends on a few unusually large winners.
- Above 2.5 or 3.0: This may be outstanding, but it can also signal curve fitting, selective data, low trade count, or unrealistic backtesting assumptions.
The key is not to worship a single number. A profit factor of 1.4 across 400 trades may be more useful than a profit factor of 3.8 across 12 trades. Reliability matters.
Benchmarks change by trading style
The question “what is a good profit factor in trading” becomes easier when you separate strategies by holding period and trade frequency. Shorter-term strategies often accept lower ratios because they generate more opportunities. Longer-term strategies usually need a higher ratio because each trade carries more time, capital, and uncertainty.
Scalping strategies
Scalpers often operate with tight targets, fast exits, and many trades. Because each trade may have a small edge, a profit factor between 1.2 and 1.5 can be acceptable if execution is disciplined and transaction costs are low. A scalper with a 1.3 profit factor may still do well if the strategy repeats often and avoids large outlier losses.
Costs matter heavily here. A backtest that ignores spread and slippage can turn a promising scalping strategy into a weak or losing one. For scalpers, the difference between gross and net profit factor is often the difference between theory and reality.
Day trading strategies
When traders ask, “what is a good profit factor in day trading,” a practical range is often around 1.3 to 2.0. Day traders need enough margin above breakeven to absorb commissions, missed entries, emotional mistakes, and changing intraday volatility. A 1.4 profit factor may be worth continuing if it appears over many trades and across different sessions.
The important step is to segment results. A day trader may discover that morning trades have a profit factor of 1.8 while late-afternoon trades sit at 0.9. That insight is more useful than the blended average because it shows where the edge actually lives.
Swing and position trading strategies
Swing traders usually take fewer trades and hold positions longer, so a profit factor around 1.5 to 2.5 or higher is often more attractive. Position traders may look for 2.0 or above, but they also need patience with smaller sample sizes. A long-term strategy can take months or years to produce enough trades for a stable reading.
For these styles, one or two large winners can distort the number. That does not mean the strategy is bad, but it does mean you should examine whether the profit factor depends on rare events that may not repeat.
Profit factor is useful because it balances wins and losses
Win rate tells you how often a strategy wins. Profit factor tells you whether the winning trades are large enough, in total, to overcome the losing trades. This is why profit factor is one of the more useful trading metrics for comparing strategies that have very different win rates.
A strategy with a 70% win rate can still lose money if the average loss is much larger than the average win. A strategy with a 40% win rate can be profitable if its winners are large enough to cover many small losses. Profit factor captures that relationship in one clean ratio.
This makes it especially helpful when comparing two systems:
- A high-win-rate mean reversion strategy with small winners and occasional sharp losses
- A lower-win-rate trend strategy with many small losses and occasional large winners
- A breakout strategy that works well only in volatile markets
- A day trading setup that performs well in the first hour but poorly during midday chop
Profit factor does not tell the full story, but it quickly shows whether the money balance is favorable. It is a reality check against strategies that feel good because they win often but quietly leak money through oversized losses.
The biggest mistakes traders make with profit factor
Profit factor looks simple, which is why it is easy to misuse. The most common mistakes come from calculating it too optimistically, trusting too little data, or treating the ratio as a direct measure of income.
Ignoring commissions, spreads, fees, and slippage
Always calculate profit factor twice if possible: once gross and once net. Gross profit factor shows the strategy before costs. Net profit factor shows what is left after the real friction of trading.
A simple process helps:
- Export every closed trade from your platform or journal.
- Add commissions, exchange fees, spread costs, and estimated slippage where they apply.
- Recalculate each trade’s final profit or loss after costs.
- Sum the adjusted winners and adjusted losers.
- Divide adjusted gross profit by adjusted gross loss.
This net number is the one that matters most. If a strategy drops from 1.45 gross to 1.08 net, it may not have enough edge to trade live. If it stays near 1.35 after costs, it may still be worth improving.
Trusting small samples
A high profit factor over a small number of trades can be mostly luck. As a practical rule, 50 trades may show an early directional clue, 100 or more trades provide better confidence, and 200 or more trades are more useful for serious evaluation. Even then, the quality of the sample matters as much as the count.
A sample should include different days, volatility levels, market phases, and normal execution conditions. If all the trades came from one unusually smooth trend, the result may not represent the future. The goal is to measure a strategy, not a lucky market window.
Chasing the highest possible ratio
Many traders assume a higher profit factor is always better. It is not that simple. Chasing a very high ratio can lead you to filter out so many trades that total opportunity disappears.
For example, a strict version of a strategy might show a 3.0 profit factor but produce only five trades per quarter. A broader version might show a 1.6 profit factor and produce 40 trades per quarter. Depending on position size, risk, and consistency, the lower ratio may create more usable profit.
This is why profit factor must be interpreted beside trade frequency. A beautiful ratio with almost no trades may be less valuable than a modest ratio attached to repeatable, well-managed opportunities.
How to use profit factor with other trading metrics
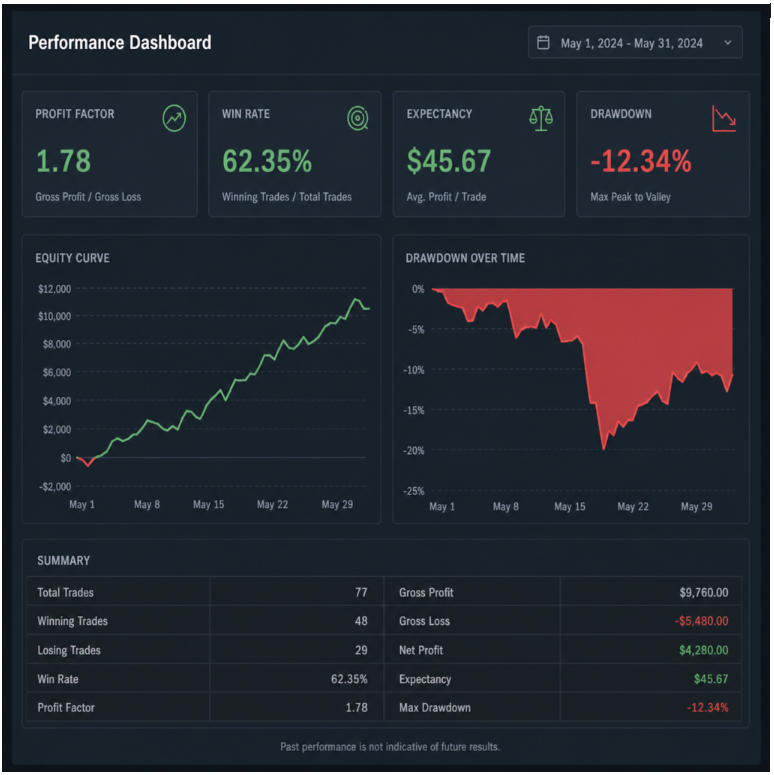
Profit factor works best as part of a group of trading metrics. It tells you whether winners outweigh losers, but it does not explain volatility, drawdowns, trade frequency, or the psychological difficulty of following the system.
Pair it with these measures:
- Expectancy: Shows the average amount you expect to make or lose per trade. This helps connect profit factor to position size and trade frequency.
- Win rate: Shows how often the strategy wins, which affects confidence, losing streaks, and trader psychology.
- Average win and average loss: Reveals whether the strategy depends on large winners, tight losses, or both.
- Maximum drawdown: Shows the worst peak-to-trough decline and helps you decide whether the strategy is emotionally and financially tolerable.
- Trade count: Adds context. A profit factor without sample size can be misleading.
- Sharpe ratio or other risk-adjusted metrics: Helps evaluate returns relative to volatility, which profit factor does not measure.
Think of profit factor as the first strong filter. If it is below 1.0, the strategy clearly needs work. If it is above 1.0, the next step is to ask whether the return is stable, repeatable, and worth the risk.
Segmenting profit factor reveals where the edge is
A single blended number can hide valuable detail. The real power of profit factor trading analysis often appears when you break results into smaller groups. This helps you stop trading weak conditions and focus on the setups that actually pay.
Useful ways to segment your results include:
- By setup type: Breakouts, pullbacks, reversals, continuation trades, news trades, or mean reversion setups.
- By time of day: Opening session, midday, closing session, overnight, or specific market hours.
- By day of week: Some strategies behave differently on Mondays, Fridays, or around major scheduled events.
- By market condition: Trending, range-bound, high volatility, low volatility, risk-on, or risk-off.
- By instrument: Stocks, futures, forex pairs, crypto assets, indexes, or individual tickers.
- By direction: Long trades and short trades may have very different performance profiles.
Suppose a trader has an overall profit factor of 1.35. At first glance, the strategy looks decent but not exciting. After segmentation, the trader finds that pullback trades in trending markets have a profit factor of 2.1, while breakout trades during low-volume periods sit at 0.8. That discovery gives the trader a clear action plan: emphasize the high-quality setup and either revise or remove the weak one.
This is where profit factor becomes more than a score. It becomes a diagnostic tool.
A practical checklist before trusting your profit factor
Before making decisions from a profit factor number, run through a short quality check. This prevents overconfidence and helps you compare strategies more fairly.
- Have you included every trade, not just the clean examples?
- Did you calculate profit factor after commissions, spreads, fees, and slippage?
- Is the sample large enough to be meaningful for your trading style?
- Does the sample include different market conditions?
- Are one or two big winners responsible for most of the result?
- Does the strategy still work when broken down by setup, time, and instrument?
- Is the drawdown acceptable relative to the return?
- Can you actually execute the strategy in real time without hesitation or rule-breaking?
- Does the strategy produce enough trades to matter?
- Are live results close to backtested or simulated results?
If several answers are weak, do not discard the metric; improve the analysis. Profit factor is most useful when the data behind it is complete, realistic, and organized.
Turning profit factor into better decisions
Once you know how to calculate profit factor, the next step is to use it constructively. Do not simply label a strategy “good” or “bad.” Ask what the ratio reveals about your process.
If profit factor is below 1.0, look for structural problems. Are stops too wide? Are targets too small? Are you entering late? Are you trading poor market conditions? The goal is not to force the number higher through random tweaks, but to identify whether the strategy has a fixable weakness.
If profit factor is between 1.0 and 1.3, focus on costs and selectivity. Small improvements in execution, trade filtering, or average loss size can matter a lot in this range. This is also where many strategies look profitable on paper but struggle live.
If profit factor is strong, protect the edge. Avoid adding unnecessary rules just to make the backtest look perfect. Instead, test whether the result holds across time periods, instruments, and market regimes.
The takeaway
Profit factor is a clear, practical metric for understanding whether a trading strategy makes more from winners than it loses from losers. The core calculation is simple: divide gross profit by gross loss, then interpret the result in context.
The best traders do not ask only, “what is a profit factor in trading?” They ask whether the number is net of costs, supported by enough trades, consistent across conditions, and useful beside other metrics. A good profit factor can point to a real edge, but the real advantage comes from knowing why the edge exists and when it is most likely to appear.