 By Benjamin Roure L'Hermitte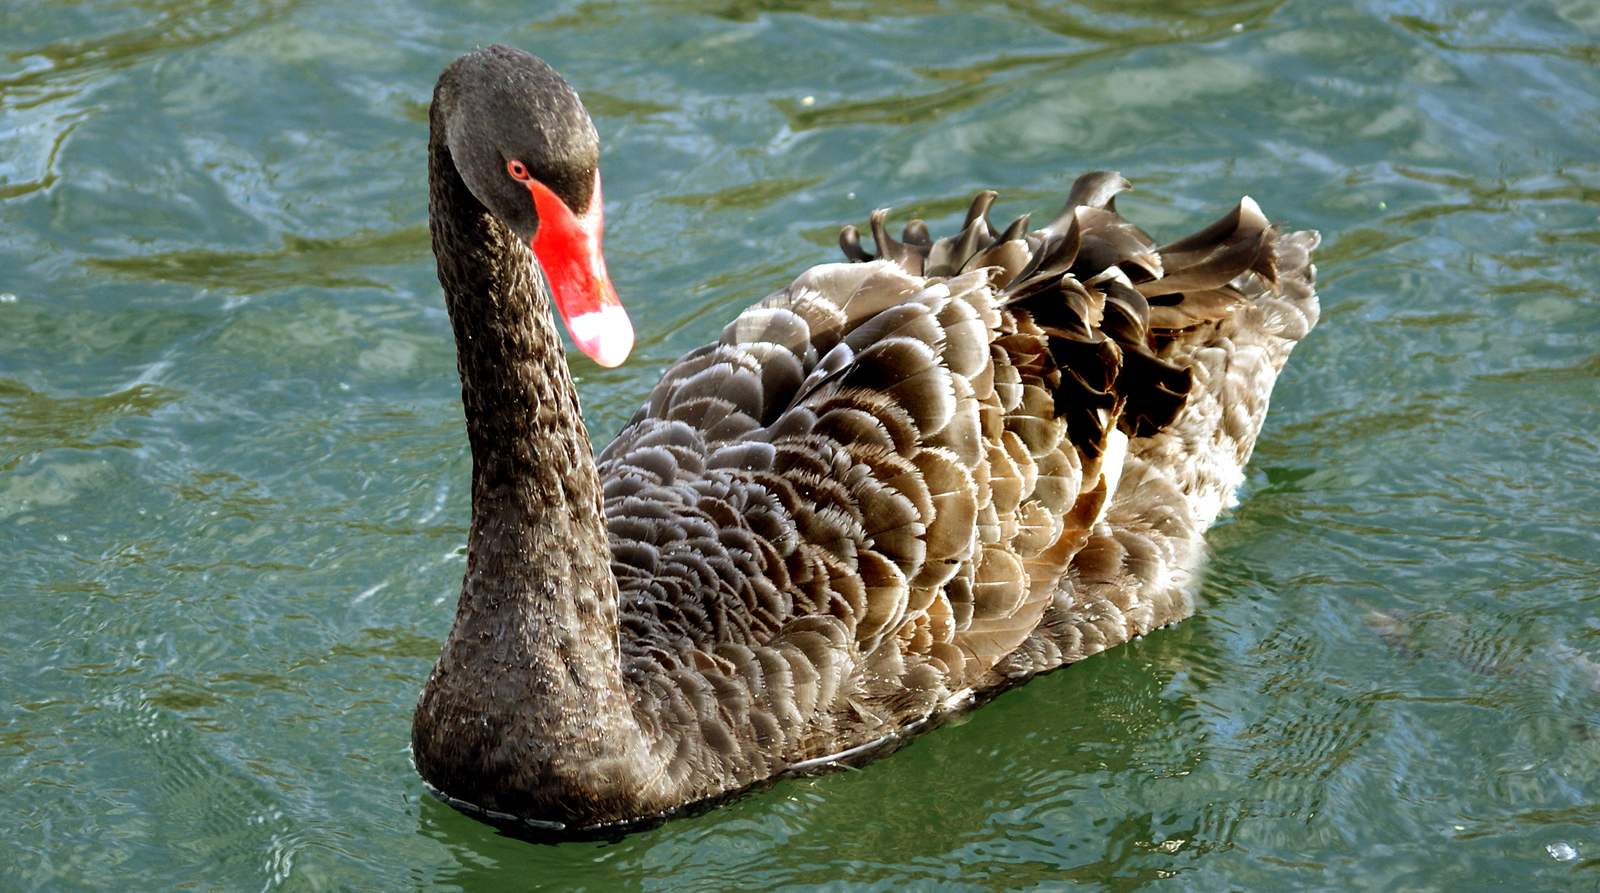
A black swan event is a rare, extreme-impact event that nobody expected and that everybody explains after the fact. The term comes from Nassim Nicholas Taleb, and for a trader it says one simple thing: the worst day of your account is probably not in your history yet. This guide goes back to the original definition, five dated and measured sessions, and what actually depends on you: your size, your leverage and what you expect from a stop.
- Three criteria, not one: rarity, extreme impact, and an explanation that only arrives afterwards.
- Your backtest does not contain it: a track record only shows what has already happened.
- A stop does not guarantee a price: when the market gaps, it fills at the first available price.
- What is in your hands: position size and leverage, decided before, not during.
The expression is everywhere, and it has ended up meaning any red day. That is a pity, because the original idea is more useful than the cliché: it is not about a big drop, it is about the limit of what a track record can teach you.
This guide predicts nothing and does not tell you what to buy. It brings together what the original texts say, what regulators' reports say and a little arithmetic, so that you know what your account takes if the market one day does what it has never done.
What is a black swan event? Taleb's definition
The term comes from Nassim Nicholas Taleb's book The Black Swan, published in 2007. In the book's prologue, reproduced by the University of St Andrews, he starts from an image: before the discovery of Australia, people in the Old World were convinced that all swans were white, and everything they observed confirmed it. A single black bird was enough to invalidate a statement drawn from millennia of confirming sightings.
Taleb then gives three attributes. First, the event is an outlier: it lies outside the realm of regular expectations, because nothing in the past can convincingly point to its possibility. Second, it carries an extreme impact. Third, human nature makes us concoct explanations after the fact that make it explainable and predictable. He sums up the triplet himself: rarity, extreme impact, and retrospective, though not prospective, predictability.
The same prologue lists the market crash of 1987 among the events that follow these dynamics. And it aims straight at finance: ask a portfolio manager for his definition of risk, Taleb writes, and odds are he will give you a measure that excludes the possibility of the black swan.
What is not a black swan
The author of the term is the first to dispute the way it is used. In an April 2020 article in The New Yorker, Taleb says he is irritated whenever the coronavirus pandemic is called a black swan. His book, he told the journalist, was not meant to provide a cliché for any bad thing that surprises us. The article reports that he considered that pandemic wholly predictable, hence a white swan.
At your own scale, the same rigour is useful. A run of seven losses, an economic release that slips your stop by a few points, a drawdown a little deeper than the last one: none of that is a black swan. Those are events your history already contains, or that a probability calculation announces. The word should be kept for what changes scale: a loss out of all proportion to what you had planned to risk.
Five sessions that looked out of reach the day before
No list is authoritative, and nothing says Taleb would file all these dates under his label. These are five episodes documented by a central bank, a regulator or an exchange, in which price did what almost nobody had put in their scenarios.
| Date | Market | What happened | Document read |
|---|---|---|---|
| October 19, 1987 | US stocks | Dow Jones: down 508 points, or 22.6%, in one session | Federal Reserve History |
| May 6, 2010 | US stocks and futures | Indices already down more than 4%, then a further 5 to 6% in minutes | CFTC and SEC staff report |
| January 15, 2015 | Swiss franc | End of the minimum exchange rate of CHF 1.20 per euro | Swiss National Bank |
| March 9, 12, 16 and 18, 2020 | US stocks | Four market-wide trading halts, at the 7% decline threshold of the S&P 500 | US exchanges' working group report |
| April 20, 2020 | WTI crude oil | May contract: from $17.73 to a settlement of −$37.63 per barrel | CFTC press release |
October 19, 1987. The Federal Reserve History essay on the 1987 crash describes it as the first contemporary global financial crisis: that Monday, the Dow Jones finished down 508 points, or 22.6%. The leverage arithmetic is immediate. With an exposure equal to five times your capital on the index, a 22.6% fall is 22.6 × 5 = 113% of that capital: more than the account.
May 6, 2010. According to the joint CFTC and SEC staff report on May 6, 2010, the major indices, already down more than 4%, plunged a further 5 to 6% in a matter of minutes before rebounding almost as quickly, to close about 3% below the prior day. The report counts over 20,000 trades, across more than 300 securities, executed at prices more than 60% away from their values moments before, some at a penny or less. It also notes that stop-loss orders and market orders from retail customers, routed by following the price down, ended up reaching unrealistically low bids.
January 15, 2015. The Swiss National Bank's press release of 15 January 2015 fits on one page: the bank discontinues the minimum exchange rate of CHF 1.20 per euro and at the same time lowers its interest rate to −0.75%. For anyone holding a position that leaned on that floor, the level that served as a reference ceased to exist the minute it was published. A stop placed just behind a level an institution defends is only worth something for as long as it defends it.
March 2020. The report of the US exchanges' working group on market-wide circuit breakers records four market-wide trading halts, on March 9, 12, 16 and 18, 2020. The mechanism triggers when the S&P 500 falls 7% from the prior day's close, then 13%, then 20%; at the first two thresholds, all trading stops for fifteen minutes. During those fifteen minutes, a stock position cannot be closed at any price.
April 20, 2020. According to the CFTC press release on the WTI contract, the May WTI crude oil futures contract fell from $17.73 per barrel to settle at −$37.63, the day before it expired. It was the first time the contract had traded at a negative price since it was listed, 37 years earlier. A buyer at $17.73 still holding at the settlement lost 17.73 + 37.63 = $55.36 per barrel, more than three times the price paid. 'I cannot lose more than the asset is worth' was false that day.
Fat tails: extremes are less rare than the bell curve says
Statisticians have a name for part of the phenomenon. Rama Cont's paper 'Empirical properties of asset returns', published in Quantitative Finance in 2001, lists several regularities found across very different markets and instruments. Returns have heavy tails: their distribution seems to display a power-law tail, which excludes the normal distribution. Gains and losses are asymmetric: one observes large drawdowns in stock prices and index values, but not equally large upward movements. And volatility clusters: high-volatility events tend to follow one another.
For you, this translates into two reflexes. A risk calculation built on a bell curve underestimates how often extreme days occur. And one extreme day often announces others: the four halts of March 2020 fit within eight sessions. Be careful, though, not to confuse the two ideas. Fat tails are a measured property you can reckon with. Taleb's black swan goes further: it is what you had not imagined at all.
What your backtest cannot tell you
A backtest replays your method on past prices. So it only contains events that have already taken place, over the period and market you chose. Yet Taleb's first criterion is precisely that nothing in the past convincingly pointed to the event. A test on ten years of data cannot contain what will happen for the first time in the eleventh year, even if you know how to backtest a trading strategy honestly.
The most concrete consequence concerns your maximum drawdown. It is the worst trough observed, not the worst trough possible. Read it as a floor for what your method can put you through, and set beside it a question no track record answers but a calculation settles in a minute: what happens to my account if the market moves five or ten times my stop distance without a single trade taking place in between?
A stop does not guarantee your price
Many traders think of their risk as a certainty: a stop twenty points away, so a maximum loss of twenty points. The SEC's page on types of orders describes something else. A stop order, the US regulator writes, becomes a market order when the stop price is reached. And a market order guarantees that the order will be executed, but does not guarantee the execution price.
The gap between the stop level and the price you get is called slippage. Most of the time it is counted in fractions of a point. When the market gaps, it has no bound. Take a trade where you risk 1% of your account with a stop twenty points away: if the first price traded after an announcement is a hundred points from your entry, you are filled at five times the planned distance, and the loss is 5%, not 1%. The stop remains essential, because it caps the loss in almost every session. It does not cap it in the ones this article is about.
Leverage and negative balances: what the European rule says
With leverage, the loss can exceed the deposit. The European Union dealt with this point for retail clients trading CFDs. ESMA's press release of 27 March 2018 announces five measures, including leverage capped from 30:1 on major currency pairs down to 2:1 on cryptocurrencies, a margin close-out when margin falls to 50% of the minimum required, and negative balance protection on a per account basis, which the regulator presents as an overall guaranteed limit on retail client losses. The release specifies that these measures were adopted for renewable three-month periods: check with your broker and its regulator what applies to your account today.
The arithmetic shows what that protection changes. A €2,000 account at 30:1 leverage carries a €60,000 position. A 10% gap against you, with no trade in between, is a €6,000 loss, three times the account. With negative balance protection, the loss stops at the €2,000 deposited. Without it, you owe €4,000. This rule targets retail clients' CFDs: it says nothing about a futures account, an account classified as professional or a broker established outside the European Union. In those cases your contract is what counts, and it is read before, not after. The mechanics are detailed in the guide to what leverage is in trading.
The arithmetic of getting back to breakeven
A loss and the gain that erases it are not symmetrical, because the gain is computed on a reduced capital. The gain required equals the loss divided by one minus the loss. After a 20% loss, it takes 0.20 ÷ 0.80 = 25% to get back to where you started.
| Loss on the account | Gain needed to get back to breakeven |
|---|---|
| 10% | 11.1% |
| 20% | 25% |
| 30% | 42.9% |
| 50% | 100% |
| 75% | 300% |
| 90% | 900% |
This table explains why a single extreme session weighs more than months of ordinary work. Ten 1% losses can be made up; a 50% loss requires doubling the account. That is the reasoning behind the risk of ruin: before trying to earn more, check that no scenario takes you out of the game.
What is in your hands
You choose neither the date nor the market of the next extreme event. You choose how much your account weighs on that day. Four questions are enough, and none of them requires forecasting anything.
- Your size: if your stop is filled at five times the planned distance, is the loss still bearable? At 1% risk per trade that is 5%; at 5% it is 25%.
- Your real leverage: the total value of your positions divided by your capital, all positions combined, and not the maximum leverage shown on your account.
- Your positions that move together: three trades in the same direction on related assets count as one on the day everything drops.
- Your contract: is your account protected against a negative balance, and what do your broker's terms provide for when the market gaps?
None of these answers removes the risk. They only move the question, from 'will it happen?', which nobody can answer, to 'what does it cost me if it does?', which can be calculated.
What a trading journal brings here
A trading journal predicts no black swan, and neither does Tradoshi. It serves another purpose: bringing your trades together in one place and drawing your statistics from them, including your drawdown, so that you answer the questions above with your numbers and not with an impression. Knowing what you really risk per trade is the starting point for everything else.
Frequently asked questions
What does black swan mean in the stock market?
It is a rare event with an extreme impact, which nothing in the past convincingly pointed to and which is explained afterwards as if it had been predictable. The definition comes from Nassim Nicholas Taleb, in his book The Black Swan, published in 2007.
What are the three criteria of a black swan?
Taleb sums them up this way in the prologue of his book: rarity, extreme impact, and retrospective though not prospective predictability. In other words, the event lies outside expectations, it changes the scale of the consequences, and explanations are only found for it afterwards.
Was the 2020 pandemic a black swan?
Not according to the author of the term. In an April 2020 article in The New Yorker, Taleb says he is irritated that the pandemic is called a black swan: he considered it wholly predictable, hence a white swan. The sessions of March 2020 nonetheless triggered four market-wide trading halts in the United States.
Does a stop loss protect against a black swan?
Not entirely. According to the SEC, a stop order becomes a market order when its price is reached, and a market order guarantees execution, not the price. If the market gaps through your level, you are filled at the first available price, which can be far away. The stop caps the loss in almost every session, not in extreme ones.
Can you lose more than your deposit?
With leverage, yes, when the market moves faster than your position can be closed. In March 2018 ESMA announced negative balance protection for retail clients trading CFDs in the European Union. It does not cover other products or other client statuses: read the terms of your account.
Can a backtest predict a black swan?
No. A backtest only contains events that already occurred over the tested period, whereas a black swan is by definition what the past did not announce. Your maximum drawdown in a backtest is the worst trough observed, not the worst trough possible.
How much do you need to gain back after a big loss?
The gain required equals the loss divided by one minus the loss. After a 10% loss you need 11.1%; after 30%, 42.9%; after 50%, 100%; after 75%, 300%. That is what makes a single extreme session costlier than many small losses.