
You typed forex trading lessons for beginners into a search bar because you're tired of scattered advice. One video promises easy money, one forum thread drowns you in jargon, and nobody tells you what to learn first. Fair enough. This guide gives you an actual order: what to understand before you touch a chart, what vocabulary you need before your account statement makes sense, and what habits keep you in the game long enough to get good.
- Forex is the global currency market, open nearly 24 hours a day, five days a week.
- Vocabulary first: pip, spread, lot, leverage and margin aren't optional extras, they're the language your account speaks.
- Risk management matters more than any entry trick, it decides whether you're still trading in six months.
- A demo account is your training ground, not a box to tick before jumping into real money.
What forex actually is
The foreign exchange market, forex for short, is where the world's currencies get traded against each other. No trading floor, no opening bell like the New York Stock Exchange. It's a decentralized web of banks, funds, institutions and individual traders, all connected electronically. It runs five days a week, essentially around the clock, following the sun as it rises over each financial center: Sydney opens, then Tokyo, then London, then New York. That continuity changes how you work compared to stocks, where everything happens in a narrow daily window.
On forex you never trade a currency alone, you trade a pair. Buying EUR/USD means betting the euro strengthens against the dollar. Selling the same pair means the opposite bet. Each pair has its own personality: EUR/USD is known for being relatively calm and liquid, USD/JPY reacts sharply to Bank of Japan announcements, and an exotic pair like USD/TRY can swing violently with almost no warning. That detail has a direct impact on how you size your risk, something we'll come back to.
Why does this market pull in so many beginners? Access. You can open an account with a few hundred dollars, sometimes less with a micro account, and place your first trade within the hour. That ease of entry cuts both ways: it attracts people with no training and no plan, which is exactly why the beginner failure rate is so high. This guide exists to change that math for you, not to sell you a fantasy.
Currency pairs: majors, minors, exotics
Major pairs are the eight most traded currencies paired with the US dollar: EUR/USD, GBP/USD, USD/JPY, USD/CHF, AUD/USD, USD/CAD, NZD/USD. They stand out for enormous liquidity and generally tighter spreads, the gap between the buy and sell price. For a beginner this is almost always where you start. Price action tends to be cleaner, less choppy from thin liquidity.
Minor pairs, or crosses, leave the dollar out entirely: EUR/GBP, GBP/JPY, EUR/CAD for instance. Still liquid, just a notch below the majors, with slightly wider spreads. Exotic pairs combine a major currency with one from an emerging economy: USD/ZAR, EUR/TRY, USD/MXN. The potential move is bigger, but so is the spread, and volatility that can trap a beginner in ten minutes flat.
A classic rookie mistake: jumping into an exotic pair because some video promised fast gains there. A big move isn't a gift, it's an uncalibrated risk if you don't have the experience to manage it. Stick to three or four majors while you learn to read the market. You can widen out later if it makes sense.
The vocabulary you cannot skip: pip, spread, lot, leverage, margin
You cannot move forward without this base layer. A pip (percentage in point) is the smallest standard unit of price movement for most pairs, usually the fourth decimal place (0.0001). If EUR/USD moves from 1.0850 to 1.0860, that's a 10-pip move. Pairs involving the Japanese yen are quoted to the second decimal instead, a classic trap for newcomers who forget to adjust their math.
The spread is the gap between the buy price (ask) and the sell price (bid). It's effectively the hidden cost of your trade, quieter than a listed commission but just as real. A 1-pip spread on EUR/USD counts as tight; a 15-pip spread on an exotic pair at 3am counts as expensive. Check the spread before you open a position, especially during quiet hours.
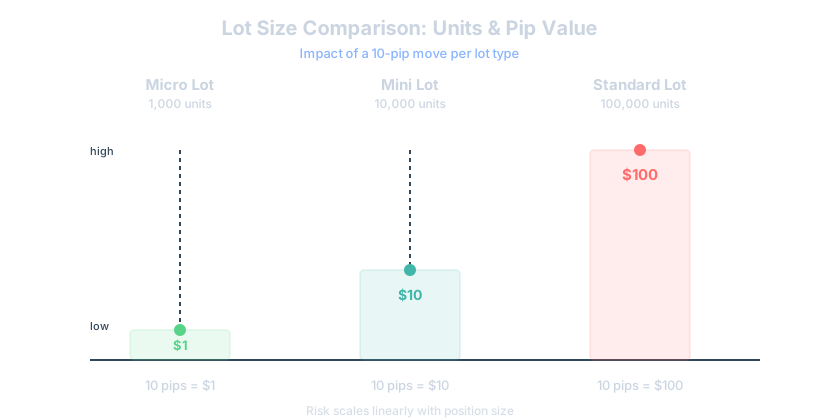
A lot is the standard unit of position size: a standard lot equals 100,000 units of the base currency, a mini lot 10,000, a micro lot 1,000. Most beginners start with micro lots, which is sensible. It limits the damage of a mistake while you're still learning to read a chart properly.
Leverage lets you control a position bigger than your actual capital. Leverage of 1:100 lets you control 10,000 dollars with just 100 dollars of margin. It magnifies gains, and it magnifies losses exactly the same way, no exceptions. Margin is simply the deposit your broker locks up to let you open that leveraged position. Plenty of beginners confuse the leverage available on their account with the leverage they're actually using, and it's that second number that determines real risk. If you want to go deeper on this, the piece on displacement in trading shows how sharp price moves interact with the leverage you're carrying.
Reading a price chart: candlesticks, support and resistance
The Japanese candlestick chart became the standard because it packs so much into one shape. Each candle shows four prices: open, close, high and low over a given period. A green body (or white, depending on the platform) means price closed higher than it opened; a red body (or black) means the reverse. The wicks, those thin lines above and below the body, show how far price stretched during the period before snapping back.
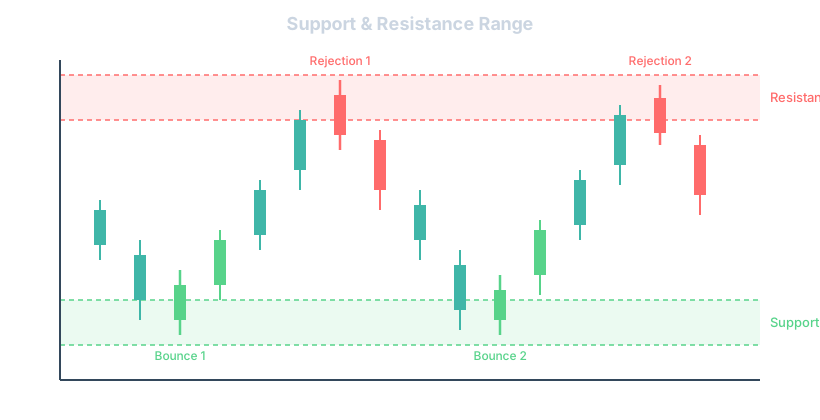
Two concepts frame most of technical analysis: support and resistance. Support is a price zone where a decline tends to stall, where buyers step back in. Resistance is the mirror image, a zone where price bumps its head and turns lower. These aren't exact laser lines, they're zones. A beginner who draws a perfectly precise line and gets annoyed that price 'overshoots' by two pips before reversing has simply misunderstood what a zone actually is.
There's a more refined cousin of this idea: supply and demand zones, where large players leave a footprint of imbalance between buyers and sellers. Once you've digested the basics, the article on supply and demand zones goes further into that territory. Don't rush there too fast though, master plain support and resistance first, it's the foundation everything else sits on.
Order types and placing your first trade
Three families of orders show up constantly. A market order executes immediately at the available price: simple, fast, but you take whatever price is on offer, spread included. A limit order schedules a buy below the current price or a sell above it, at a level you choose in advance, useful for entering on a pullback without staring at the screen all day. A stop order does the opposite: it triggers a buy above the market or a sell below it, often used to catch a breakout.
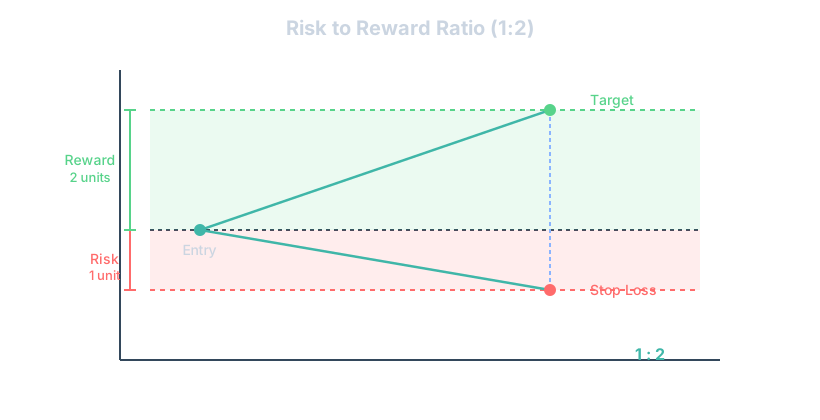
Here's what a first trade might look like, purely as an illustrative example: you notice EUR/USD bouncing repeatedly off support at 1.0800. You place a buy limit order at 1.0805, a stop loss at 1.0780 (25 pips of risk), and a target at 1.0855 (50 pips of potential reward). That 1 to 2 ratio between risk and reward isn't random. We'll unpack why in the risk management section below.
Before you run this kind of order with real money, execute it on a demo account a solid ten times. Note what actually happens: did the limit order fill at the price you expected, or was there slippage? Did the stop loss trigger cleanly? These are technical details that, misunderstood, get expensive fast once real money is on the line.
Basics of technical and fundamental analysis
Technical analysis assumes price already reflects available information and that its history offers clues about what comes next. Moving averages are the most common tool for beginners: they smooth out price noise to reveal a trend. A crossover between a fast and a slow moving average often serves as an entry or exit signal. The topic deserves real depth, which you'll find in the dedicated article on moving averages for your entries and exits.
Fundamental analysis looks at the economic causes behind moves: central bank interest rates, inflation, employment, geopolitical tension. A Federal Reserve decision on rates can move USD/JPY dozens of pips in minutes. A beginner doesn't need to become an economist, but ignoring the economic calendar entirely means walking into surprises you could have seen coming just by glancing at the week's scheduled announcements.
The real question isn't technical versus fundamental, it's how to make them work together. Many traders use fundamentals to set the general direction, a currency expected to strengthen over months, and technicals to time the precise entry and exit. Neither approach is objectively superior, it depends on your style and your time horizon.
Risk management: the part that decides if you survive
This is the single most important section in this whole lesson, by a wide margin. Most beginners skip it entirely, jump straight to hunting for the perfect entry signal, and blow up an account within weeks. Here's the blunt truth: a mediocre strategy with strict risk rules will outlast a brilliant strategy with none, every single time. Risk management is what keeps you at the table long enough for your edge, if you have one, to actually show up in the results.
Start with position sizing. A common guideline among disciplined traders is to risk somewhere around 1 percent of account capital on any single trade, sometimes less while learning. On a 2,000 dollar account, that's 20 dollars of risk per trade, illustrative example. If your stop loss sits 25 pips away and each pip is worth 0.80 dollars for your position size, you can work backward to figure out exactly how many lots you should be trading. Guessing your size instead of calculating it is one of the fastest ways to turn a small mistake into a big one.
The stop loss is not optional decoration, it's your exit plan written down before emotion has a chance to interfere. Placing it too tight means normal market noise stops you out constantly; placing it randomly wide because you 'believe in the trade' means one bad trade can undo weeks of gains. The article on where to actually place a stop loss walks through this in more detail, and it's worth reading once the basics here feel comfortable.
Then there's the risk to reward ratio, the relationship between what you're willing to lose and what you're aiming to gain. A 1:2 ratio means risking 1 dollar to potentially make 2. Even a trader who's right less than half the time can be profitable overall with a solid ratio, purely as illustration. Understanding this changes how you evaluate a setup: it's never just 'will this trade win', it's 'does the math make sense if it doesn't'. For the full breakdown, the guide on the risk to reward ratio explained simply covers it well.
Choosing a broker and opening a demo account
Not every broker deserves your money. Look for solid regulation from a recognized authority, transparent spreads, and a withdrawal process that doesn't require three emails and a phone call to actually get your funds. Read reviews with a skeptical eye, because plenty of them are paid promotion dressed up as advice. A broker's platform stability matters too: if it freezes during high volatility right when you need to close a position, that's not a minor inconvenience, that's money lost.
A demo account replicates live market conditions using virtual money. Use it seriously, not as an afterthought. Treat it the way you'd treat a flight simulator before flying real passengers: practice your order types, test your risk rules under pressure, get a feel for how fast prices move during news releases. Spending two or three months there before funding a live account isn't wasted time, it's the cheapest tuition you'll ever pay in trading.
One thing a demo account cannot fully replicate is the emotional weight of real money. You'll trade differently, often more carefully, once your own cash is on the line. That's normal. The transition from demo to live should be gradual: start small once you go live, smaller than you think you need to, and scale up only once your results hold steady over a meaningful number of trades.
Common beginner mistakes and trading psychology
Overtrading tops the list. A beginner opens the platform, sees ten setups that look promising, and takes all ten. Three months later the account is down 40 percent, not because any single trade was catastrophic, but because volume of mediocre decisions compounds fast. The article on overtrading and why you take too many positions digs into why this happens and how to catch yourself doing it.
Revenge trading is the twin sibling of overtrading. You lose a trade, get angry, and immediately open a bigger position to 'win it back'. It rarely works, because the decision comes from frustration, not from a plan. If this pattern sounds familiar, the piece on the mechanism behind revenge trading explains exactly what happens in your head in that moment, and how to break the loop before it costs you your week.
FOMO deserves a mention too: watching a pair rip higher without you, then jumping in late out of pure fear of missing more. You typically buy near the top of the move, right when the smart money is already taking profit. Beginners chase price constantly because nobody warned them how normal, and how costly, that instinct is.
A progressive learning plan: from beginner to intermediate
Don't try to learn everything in the first month. Week one and two: vocabulary, how the market works, how pairs are quoted. Weeks three and four: charts, candlesticks, support and resistance, order types, all practiced on a demo account. Month two: pick one or two indicators, understand risk management deeply, and start journaling every single demo trade, win or lose.
Months three to six: refine a single approach instead of jumping between five strategies you saw online. Consistency in method matters more than novelty. Track your results honestly, review what worked and what didn't, and only consider live trading once your demo results are stable over dozens of trades, not just a lucky week. Rushing this stage is the single biggest reason motivated beginners quit within their first year.
How Tradoshi helps you
Once you move past the pure lesson phase and start placing real trades, the challenge shifts from 'what should I learn' to 'am I actually following what I learned'. Tradoshi's trading journal imports your trades automatically from MT4, MT5, cTrader or crypto exchanges, or lets you log them manually, so you build a record instead of relying on memory. From there, stats like win rate, profit factor, expectancy, drawdown and the overall Oshi Score give you an honest picture of where you actually stand, not where you feel like you stand.
On the risk side, Tradoshi's position size calculator and customizable risk rules help you apply the percent-of-capital thinking covered earlier without doing the math by hand every time, and the daily risk calendar keeps you aware of how much you've already put at stake. The discipline score measures how well you're sticking to your own rules, which matters enormously for a beginner still building habits. And when a trade goes sideways emotionally, the emotional check-in and Trade Review features, with free labels you choose and notes on plan adherence, let you connect what you felt to what you actually did, which is often where the real lessons live.
Frequently asked questions
How long does it take to learn forex trading as a beginner?
Most people need several months of consistent demo practice before they're ready to consider live trading, and consistent profitability, if it comes, usually takes a year or more of deliberate work.
Do I need a lot of money to start forex trading?
No. Many brokers allow accounts with a few hundred dollars, some even less through micro accounts, though how much you should actually risk per trade matters more than how much you deposit.
What is the best currency pair for beginners?
Major pairs like EUR/USD are usually recommended first because of their liquidity and generally tighter spreads, which makes price action easier to read than on exotic pairs.
Is a demo account really useful or just a marketing gimmick?
It's genuinely useful if you treat it seriously: testing order types, risk rules and your reaction to volatility on a demo account saves you expensive mistakes once real money is involved.
What's the difference between a pip and a lot?
A pip measures a price movement, usually the fourth decimal of a quote, while a lot measures the size of your position, such as 100,000 units for a standard lot.
How much should a beginner risk per trade?
A commonly cited guideline is around 1 percent of account capital per trade, though beginners often start even smaller while they're still learning to execute their plan consistently.
Can I learn forex trading for free?
Yes, plenty of solid educational material exists for free, but the real learning happens through disciplined demo practice, not just watching content passively.
What is leverage and why is it risky for beginners?
Leverage lets you control a larger position than your capital would otherwise allow, which magnifies both potential gains and potential losses, and beginners often underestimate the downside side of that equation.
Should I focus on technical or fundamental analysis first?
Most beginners start with technical analysis because it's more visual and immediately applicable to charts, then layer in fundamental awareness like the economic calendar as they progress.
What is the biggest mistake beginners make in forex trading?
Skipping risk management entirely and focusing only on finding the perfect entry, which leaves the account exposed to a single bad trade or a string of ordinary losses.