
You place an order and the price runs before it even fills. Or your stop gets tagged at the exact low of the day, then the market reverses five minutes later and goes exactly where you thought it would. That's not bad luck. That's liquidity, or rather the lack of it, or someone else scooping it up before you.
- Liquidity measures how easily an asset can be bought or sold without moving its price.
- You read it through the bid-ask spread, traded volume and order book depth.
- Liquidity pools are zones where retail stop orders cluster, and big players target them.
- A liquidity sweep is a fast wick through those levels before a reversal, not a genuine breakout.
What is liquidity in trading, really
Picture a farmer's market. A vegetable stall always has buyers, at any hour, for almost any reasonable quantity. A rare truffle seller might wait days for a buyer, and if he needs to sell fast, he'll have to cut his price. That's liquidity in trading: the ability of an asset to be bought or sold quickly, in size, without distorting its price.
On EUR/USD during the London session, you can throw a multi-million order at the market and barely move price half a pip. On a small-cap crypto with thin market depth, a 5,000 dollar order can push the price up 3%. Same word, 'trading', completely different mechanics. The first market is liquid, the second isn't, and that gap changes everything about how you execute.
In practice, liquidity affects three things you feel directly in your account: how fast your order fills, the price you actually get filled at, and the hidden cost of slippage. A trader who ignores this trades as if the market were always perfectly smooth. Classic mistake, especially on exotic indices or outside peak activity hours.
Liquidity vs volatility: don't mix them up
This is confusion number one for beginners. Liquidity and volatility have nothing to do with each other, even though they often show up on the same chart. Volatility measures how far price swings. Liquidity measures how easily you can execute at that price. A market can be highly volatile AND highly liquid (Bitcoin during major news), highly volatile AND illiquid (a small-cap announcing a buyout), or barely volatile and perfectly liquid (EUR/USD on a quiet summer Friday).
Why does this distinction matter for you? Because a volatile but liquid market moves hard, yet you still get in and out near the displayed price. A volatile and illiquid market can cost you 2% in slippage alone at execution, before the actual market move even counts. Pre-market gaps on stocks show this trap well: the ticker jumps 8%, but if nobody's on the other side to absorb your order, you get filled far worse than expected.
- Volatile and liquid: forex majors during a macro release, price moves fast but fills stay clean.
- Volatile and illiquid: a penny stock after a rumor, maximum danger on execution.
- Stable and liquid: US indices in a normal session, comfortable fills even without a big move.
How to actually measure liquidity
Three indicators are enough to gauge an asset's liquidity, and you don't need a Bloomberg terminal for it. First, the bid-ask spread: the gap between the best buy price and the best sell price. Tighter spread means more liquid market. On EUR/USD you'll see spreads around 0.1 to 0.3 pip with a decent broker during active hours. On an exotic pair like USD/TRY, the spread can be ten or twenty times wider. That spread is your invisible transaction cost, the one nobody shows you but you pay on every round trip.
Then there's traded volume: the number of contracts, shares or units changing hands over a given period. High, steady volume signals a market with plenty of participants ready to transact, so you'll easily find a counterparty. One caveat though: a sudden volume spike on an otherwise quiet asset isn't necessarily lasting liquidity, it might just be a temporary burst of activity before things go quiet again.
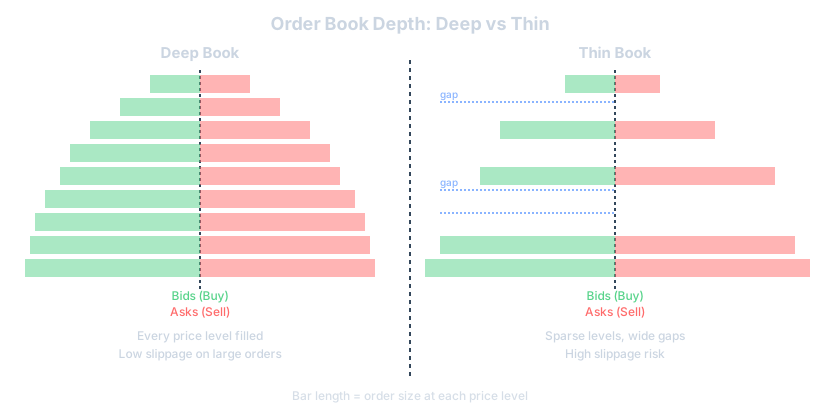
Finally, order book depth, most visible in crypto and futures markets. It shows how much volume sits at each price level around the current market price. A 'deep' book with large blocks stacked at every tick absorbs big orders easily. A 'thin' book, with just a handful of scattered orders, empties fast and lets price jump from one level to the next on a single sizable order. This is exactly what we dig into in our piece on order flow in trading, which goes deeper into reading the book in real time.
Liquid vs illiquid markets: the ranking that matters
Not all markets are equal on liquidity, and that should directly shape which assets you choose to trade. At the top: forex majors (EUR/USD, GBP/USD, USD/JPY), which post the biggest daily traded volume in the world, followed by US index futures (S&P 500, Nasdaq) and mega-cap stocks like the big US tech names. On these markets you trade with maximum execution comfort, at nearly any point in the trading day.
At the other end, you've got thinly-followed small-cap stocks, exotic forex pairs, low-cap cryptocurrencies, and options on unpopular underlyings. On these, a medium-sized order can literally move price several percent. The classic trap: spotting a beautiful technical setup on a small cap and not realizing that getting out at the right time will be far harder than getting in.
| Asset | Liquidity level | Typical spread |
|---|---|---|
| EUR/USD (forex) | Very high | Very tight |
| Large-cap US stocks | High | Tight |
| Index futures (S&P, Nasdaq) | High | Tight |
| Exotic forex pairs | Low to medium | Wide |
| Small-cap stocks | Low | Wide and variable |
| Low-cap cryptocurrencies | Very low | Very wide and unstable |
The direct hit on your slippage and results
Slippage is the gap between the price you wanted to be filled at and the price you actually got. On a liquid market, that gap is minor, often negligible for a retail trader. On an illiquid market, it can quietly wreck a strategy that looked profitable on paper. Picture a plan with a 1:2 risk-reward ratio, but where every entry costs you an average 0.3% in slippage because the asset is thin. Your theoretical edge evaporates before the trade even gets going.
This hits your stop loss especially hard. A stop placed on an illiquid asset can fill far from the intended level if the market 'jumps' a price because there's no one on the other side. It's one of the blind spots we cover in our guide on where to place your stop loss: the theoretically ideal placement is worthless if real execution betrays your plan because the market is too thin.
Slippage also bites harder when high volatility meets drying liquidity, typically right before or right after a major economic release. Many brokers widen spreads in those windows precisely because liquidity temporarily pulls out of the market: market makers don't want exposure with tight spreads amid uncertainty. The result is your market order can fill at a price noticeably different from what was quoted two seconds earlier.
Liquidity pools: where everyone else's orders are hiding
Here's the core of the topic for a lot of price action and smart money concept traders. In SMC/ICT, 'liquidity trading' isn't just about general ease of execution anymore, it points to specific zones on the chart where pending orders cluster. These zones are called liquidity pools. Every time a retail trader places a stop loss above an obvious high or below an obvious low, that's a drop added to a pool, and thousands of traders doing the same thing turn it into a substantial reservoir of resting orders.
Why do big institutional players care about these zones? Because they need a counterparty to fill their own large orders without shoving the market too far against themselves. A fund wanting to buy heavily needs sellers on the other side. Where do you easily find resting sell orders? Right above recent highs, where short traders' stops and breakout buyers' stop orders both line up. By going after that zone, the institution finds the counterparty it needs for its own execution.
There are generally two types of pools: 'buy-side liquidity', sitting above highs (where short sellers' stops and breakout buyers' orders sit), and 'sell-side liquidity', below lows (long traders' stops, breakout sellers' orders). Both zones become natural magnets for price, especially once they've built up across several sessions without being touched. If you want the theory behind why price behaves this way around these reference points, our piece on auction market theory lays out the underlying logic well.
What is a liquidity sweep and how do you spot one
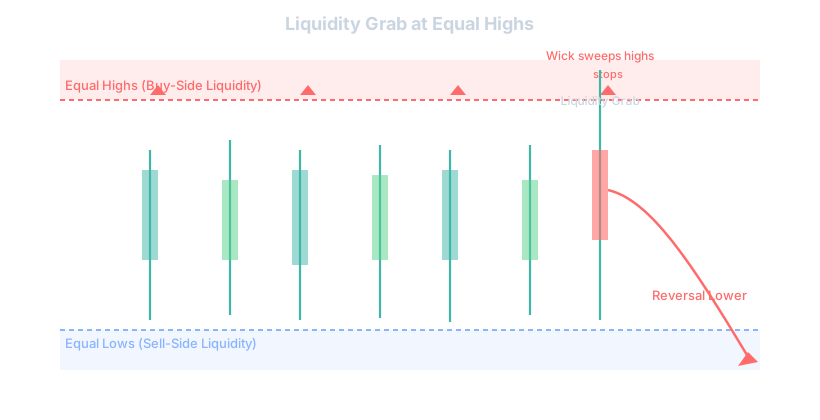
A liquidity sweep, sometimes called a liquidity grab or a stop run, is the moment price comes in and precisely touches or slightly pierces one of these obvious zones, triggers the resting orders sitting there, then snaps back the other way. Think of an equal-highs range that's held for three sessions. Price finally spikes a few pips above it, everyone watching thinks 'breakout', and thirty seconds later the candle closes back inside the range, then price drops hard. That spike wasn't a breakout. It was a sweep.
What makes a sweep is speed and rejection. A real breakout usually comes with expanding volume, follow-through, and candles that close beyond the level, not just wick through it. A sweep looks nervous: a thin wick, often on lower volume than you'd expect, and a swift return inside the range. If you're building a reading of these fast, aggressive moves, our guide on displacement in trading helps you tell a genuine impulsive move from a fakeout wick.
A practical example: EUR/USD ranges between 1.0850 and 1.0900 for two days. Thursday morning, price spikes to 1.0908, sweeping every buy stop and breakout order above 1.0900, then reverses and closes the day at 1.0820. Traders who bought the breakout got trapped. Traders who understood it as sell-side liquidity being grabbed near a prior low, waiting for confirmation after the sweep, caught the actual move. Same chart, opposite outcome, purely a matter of reading the sweep correctly.
Liquidity grab vs stop hunt: is there really a difference
You'll see these terms used almost interchangeably, and honestly the line between them is blurry. 'Stop hunt' implies intent, as if some entity is deliberately targeting your exact stop loss. 'Liquidity grab' or 'liquidity sweep' describes the same price action but frames it as a natural consequence of where orders concentrate, not a conspiracy against retail traders specifically. Nobody is watching your individual 2-lot position. What's being targeted is the aggregate pool of orders sitting at an obvious technical level, because that's where the volume needed for a large fill happens to be.
Does the distinction matter for your trading? Not hugely, in practice. What matters is recognizing that obvious levels, the ones every retail trader can see on a basic chart, are precisely the levels most likely to get run before a real move develops. Whether you call it a hunt or a grab, the trading implication is identical: don't place your stop exactly where everyone else places theirs, and don't assume every break of a level is the start of a trend.
Best trading hours for maximum liquidity
Liquidity isn't constant throughout the day, it breathes with the sessions. In forex, the overlap between London and New York sessions delivers the deepest liquidity of the day, tightest spreads, cleanest fills. Trading the same pair during the Asian session or right before London opens usually means wider spreads and thinner books, since fewer large participants are active. For US equities and index futures, the first and last hour of the regular session carry the bulk of the day's volume, while the lunch hour often turns sluggish and choppy for the wrong reasons.
This matters concretely for execution. Scalping or running tight stops during low-liquidity windows exposes you to erratic spreads and slippage that has nothing to do with your analysis being wrong. A setup that looks identical on the chart can behave completely differently depending on whether you take it at 3am or during the London-New York overlap. If your process includes reviewing what time of day actually works for you, that's a habit worth tracking systematically rather than guessing.
Trading strategies built around liquidity
Several approaches lean directly on liquidity concepts rather than pure indicators. The most common in retail SMC/ICT trading: wait for a liquidity sweep of an obvious high or low, then look for confirmation of a reversal, such as a shift in market structure or a displacement candle, before entering in the opposite direction of the sweep. The logic is that once the resting orders are consumed, the move that follows tends to be the 'real' one, no longer fueled by trapped retail positions.
Other traders use liquidity more passively, simply as a filter. Before entering any trade, they check whether there's an obvious pool of stops nearby that could get swept and invalidate a perfectly good technical idea, and adjust their stop placement accordingly, often a few pips further from the crowd rather than right on the obvious level. This ties directly into getting started with ICT concepts, where liquidity, market structure and displacement are studied together rather than in isolation.
None of this replaces sound risk management. A liquidity-based entry can fail like any other setup, and treating it as a guaranteed reversal signal is how traders start doubling down after a sweep goes the wrong way. Understanding where liquidity sits should inform your read of the chart, not turn into a rigid rule that overrides everything else. Solid rule sizing still needs to come from concepts like risk-reward planning, not from a sweep looking convincing in the moment.
Other traders use liquidity more passively, simply as a filter. Before entering any trade, they check whether there's an obvious pool of stops nearby that could get swept and invalidate a perfectly good technical idea, and adjust their stop placement accordingly, often a few pips further from the crowd rather than right on the obvious level. This ties directly into getting started with ICT concepts, where liquidity, market structure and displacement are studied together rather than in isolation.
None of this replaces sound risk management. A liquidity-based entry can fail like any other setup, and treating it as a guaranteed reversal signal is how traders start doubling down after a sweep goes the wrong way. Understanding where liquidity sits should inform your read of the chart, not turn into a rigid rule that overrides everything else. Solid rule sizing still needs to come from concepts like risk-reward planning, not from a sweep looking convincing in the moment.
How Tradoshi helps you
Liquidity concepts only pay off if you actually track how they play out in your own trading, trade after trade. Tradoshi's Trade Review lets you replay a trade and tag it with free labels you choose, so you can mark setups like 'liquidity sweep entry' or 'traded a thin session' and later filter your history to see whether that specific context actually produces an edge for you, instead of relying on a gut feeling.
The journal itself, with automatic import from MT4, MT5, cTrader and crypto exchanges, records the exact time of each entry, which makes it straightforward to check afterward whether your best trades cluster around high-liquidity windows like session overlaps, or whether you've been taking entries during quiet hours where spreads work against you. Combine that with statistics such as your profit factor, average win/loss ratio and R-multiple, and the picture of which liquidity conditions actually suit your strategy becomes objective rather than assumed.
Because thin, illiquid conditions often invite impulsive entries chasing a sudden spike, the emotional check-in before each trade and the discipline score can also flag a pattern worth watching: are you entering more emotionally right after a sweep, when a level has just been taken out and everyone's reacting? Seeing that link between context and behavior laid out plainly is often the first step to actually changing it.
FAQ: your questions on liquidity in trading answered
Frequently asked questions
What is liquidity in trading, in one sentence?
It's how easily and quickly you can buy or sell an asset in size without moving its price against you, measured mainly through spread, volume and order book depth.
What does liquidity mean in trading compared to volume alone?
Volume is one input into liquidity, but liquidity also depends on spread and order book depth. High volume with a wide spread can still mean poor liquidity for your specific order size.
What is a liquidity sweep in trading?
It's a fast, sharp move where price pierces an obvious high or low, triggers the stop orders resting there, then reverses direction shortly after, unlike a genuine breakout that holds and follows through.
How is liquidity trading different from volatility trading?
Liquidity is about ease of execution at a given price, volatility is about how much that price swings. A market can be liquid and calm, or illiquid and wildly volatile at the same time.
What is liquidity in day trading specifically?
For day traders it mainly means being able to enter and exit intraday positions quickly at fair prices, which is why most day traders stick to liquid instruments like major forex pairs or large-cap stocks during active hours.
Why do institutions target liquidity pools?
Because executing a large order requires a counterparty, and resting stop orders clustered above highs or below lows provide exactly that volume, letting a big player fill without moving the market too far against itself.
Is a liquidity sweep the same as a stop hunt?
They describe very similar price action. Stop hunt implies deliberate targeting of retail stops, while liquidity sweep frames it as a natural consequence of where order pools sit. The trading implications are essentially the same.
Which markets have the highest liquidity for retail traders?
Major forex pairs, US index futures and large-cap stocks generally offer the tightest spreads and deepest order books, making execution far more predictable than on exotic pairs or small caps.
Can low liquidity really hurt my results even with a good strategy?
Yes. Slippage on entries and stops in illiquid conditions can quietly erode a positive edge until the strategy looks unprofitable, even though the underlying analysis was sound.
What is the best time to trade for maximum liquidity?
For forex, the London-New York session overlap. For US equities and futures, the opening and closing hours of the regular session tend to carry the deepest liquidity of the day.