 By Benjamin Roure L'Hermitte
You glance at a world markets ticker in the morning and one line flashes red or green next to the word Nikkei. You know it's Japanese, you know it's stocks, and you know it tends to move before the European open. But what is a japanese stock market index actually measuring, and is it worth paying attention to even if you never touch a single Japanese stock? Short answer: yes, and here's why.
- The Nikkei 225 is a price-weighted index of 225 large companies on the Tokyo Stock Exchange, running since 1950.
- The TOPIX is weighted by float-adjusted market cap and covers a much broader slice of the market, Prime segment included.
- Both indices are hostage to the yen: a weak yen tends to push Japanese exporters higher, a strong yen tends to crush them.
- Trading these indices means understanding their calculation quirks, sector mix and macro sensitivity, not just watching a flashing number.
The Nikkei 225, Japan's historic showcase
The Nikkei 225 has been around since 1950: according to the official Nikkei 225 FAQ, daily calculation started on September 7, 1950 at the Tokyo Stock Exchange, and the Nikkei group took it over in 1970. So today it's calculated and published by the Nihon Keizai Shimbun, Japan's leading financial newspaper, roughly as if the Wall Street Journal ran the Dow Jones itself. That comparison isn't accidental either. The Nikkei 225 works like the Dow Jones: it weights components by their yen price, not by actual market capitalization.
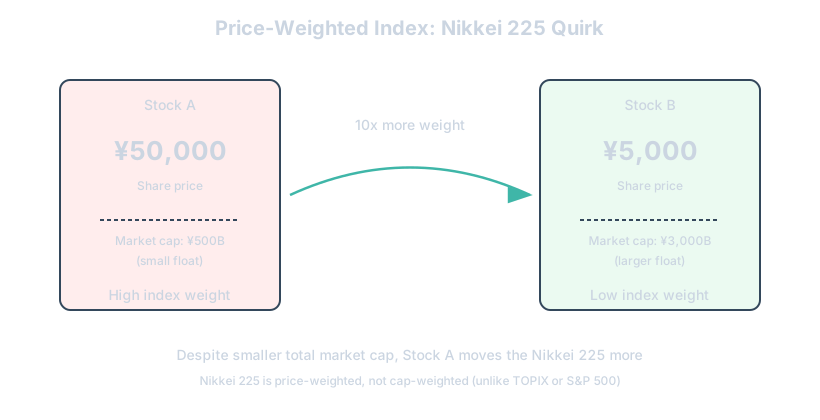
Practically, that means a stock trading at 50,000 yen carries ten times more weight in the index than a stock trading at 5,000 yen, even if the second company is far bigger in total market value. Nikkei softens that bias: according to the official Nikkei 225 index guidebook, each price is first multiplied by a price adjustment factor, set at 1 when a stock joins the index and possibly lowered, to between 0.1 and 0.9, if its price exceeds 1% of the sum of constituent prices. With equal factors, the ten-to-one ratio holds in full. The method itself is a legacy of 1950, when the Tokyo Stock Exchange published the index as an adjusted price average. The effect today: certain high-priced tech or robotics names end up swinging the whole index far more than their actual footprint in the Japanese economy would justify.
Take an illustrative case. Say a major industrial robotics maker trades at a high per-share price and drops 5% in a single session. That one stock alone can visibly drag the Nikkei 225 down, even though its real economic weight is modest next to a bank or insurer that trades at a much lower unit price. That's the classic beginner trap: you look at the Nikkei and think you're reading the whole Japanese market, when really you're reading the mood of a handful of expensive stocks.
The TOPIX, the index that actually mirrors the market
The TOPIX, short for Tokyo Stock Price Index, takes the opposite approach. It weights each company by its float-adjusted market capitalization (TOPIX index page at Japan Exchange Group), meaning the share value actually available for trading, excluding cross-held shares and stable blocks that never hit the open market. That's the same method the S&P 500 or the CAC 40 use, and it gives a far more accurate picture of each sector's real economic weight.
Historically the TOPIX covered every company listed on the Tokyo Stock Exchange's first section. The April 2022 market reform replaced the old structure with Prime, Standard and Growth segments, and the index has been revised in two stages since, as laid out in Japan Exchange Group's overview of the TOPIX revisions. The first was completed in January 2025. The second opens the index to all three segments, with periodic reviews that put more emphasis on liquidity. According to the results of the first periodic review, published by JPX on October 7, 2026, the index held 1,636 stocks at the end of August 2026 and would keep only 986 at the end of July 2028, once a phased transition is complete, plus any that pass the re-evaluation scheduled for October 2027. The result is still a far broader index than the Nikkei 225, less rattled by a single stock's swings, and generally the preferred gauge among institutional managers tracking the Japanese market as a whole.
If you had to pick one to judge the real health of Japan's equity market, the TOPIX is objectively the better thermometer. The Nikkei 225 stays the headline reference, the one everyone quotes first, a bit like the Dow Jones in the US next to the more representative S&P 500. Both have their place, but they're not telling quite the same story.
| Feature | Nikkei 225 | TOPIX |
|---|---|---|
| Weighting method | Share price | Float-adjusted market cap |
| Number of components | 225 | 1,636 at end of August 2026, about 1,000 expected by mid-2028 |
| Launched | 1950 | 1969 |
| Calculated by | Nihon Keizai Shimbun | JPX Market Innovation & Research (JPX group) |
| Main use | Headline benchmark | Institutional benchmark |
JPX-Nikkei 400 and Nikkei 500, the lesser-known cousins
A few other Japanese indices exist, rarely mentioned but worth knowing. The JPX-Nikkei 400, launched in 2014, works on a different logic: according to the JPX-Nikkei 400 methodology published by Japan Exchange Group, it selects 400 companies based on return on equity, operating profit and governance quality, not just size. The idea was to nudge Japanese companies, historically stingy toward shareholders, into improving profitability just to qualify for inclusion. It's almost as much a policy tool as a financial benchmark.
The Nikkei 500 simply widens the classic Nikkei's base to 500 names, giving a bit more sector diversification without changing the price-weighting method (official Nikkei 500 profile). For a trader active day to day, these two stay secondary. But if you're studying the long-term structure of the Japanese market or Japan's corporate governance reforms, the JPX-Nikkei 400 is genuinely revealing.
Why the yen drives almost everything
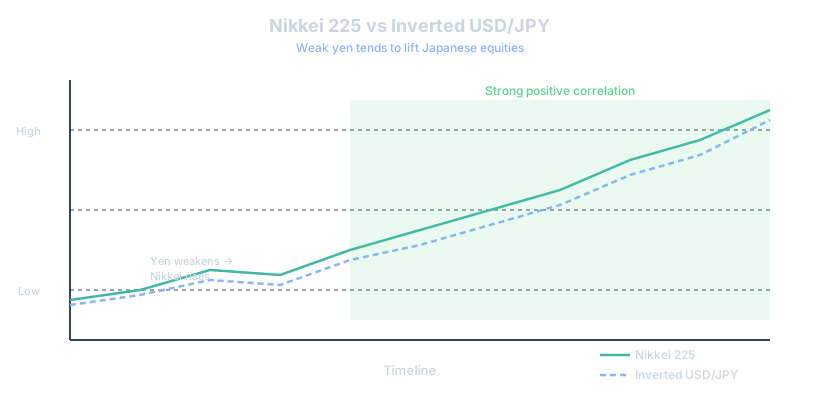
You can't talk about Japanese indices without talking about the yen. Japan runs a massively export-driven economy: cars, electronics, machine tools. When the yen weakens against the dollar or the euro, Japanese products get cheaper abroad and exporters' repatriated yen profits swell automatically. A typical pattern you'll see: a weak yen often lifts both the Nikkei and the TOPIX, while a sharply strengthening yen weighs on exporter stocks.
This correlation isn't an iron law, but it shows up often enough that anyone following Japanese indices should keep one eye on USD/JPY at all times. The Bank of Japan's historically ultra-accommodative policy kept the yen weak for years and propped up stocks. The slightest shift in BoJ tone toward raising rates can send the yen spiking and the Nikkei sliding within hours. That's exactly the kind of macro move you want to anticipate before opening a position, not discover after the fact.
Trading hours and why they matter to you
The Tokyo Stock Exchange trades from 9:00 to 11:30 am and from 12:30 to 3:30 pm, Japan time, according to the trading hours published by Japan Exchange Group: it opens in the middle of the night for Europe and closes in the very early European morning. It's a window most European or American traders sleep straight through. Yet what happens on the Nikkei during that session often sets the tone for all of Asia, and sometimes for the European open that follows a few hours later.
If you trade indices through CFDs or futures that quote near around the clock, you've probably already seen gaps or sudden accelerations on the Nikkei during the European night, often tied to a Japanese macro release, a BoJ decision, or a yen move while Western markets sit closed. Ignore that session and you're giving up an early read on market sentiment, well before Paris or New York even open.
Sector composition: what you're actually buying
The Japanese market isn't just cars and electronics, even if those sectors stay iconic. Both major indices carry a heavy weight of financials, consumer goods, services and diversified industrials, many organized into conglomerates called keiretsu, descendants of the pre-war zaibatsu groups. That web of cross-shareholdings between companies, banks and insurers is actually one reason the TOPIX's float-adjusted calculation matters so much: a meaningful chunk of large Japanese companies' capital sits with other firms in the same group, not on the open market.
For a trader coming from US or European markets, this structure can catch you off guard. You're not trading something as tech-concentrated as the Nasdaq, nor as luxury-and-energy-skewed as the CAC 40. The Nikkei and TOPIX reflect a mature industrial economy, with an aging population weighing on domestic consumption, offset by export strength that remains one of the main engines behind equity performance.
How to actually trade these indices
Three main routes exist if you want exposure to the Nikkei or TOPIX without buying Japanese stocks one by one. Index CFDs, offered by most brokers, let you go long or short with leverage, tracking the Nikkei 225 near continuously. Nikkei 225 futures, listed in Singapore since 1986 and then in Osaka and Chicago according to the history of the Nikkei 225 told by the Nikkei group, get used by more experienced and institutional traders for more structured positions. ETFs replicating the Nikkei 225 or TOPIX exist on several exchanges worldwide and suit a medium-term investing approach better than active trading.
Whichever route you pick, the reflex stays the same as for any index: never jump into a big move without knowing why it's happening. A Nikkei dropping 2% in an hour during the Asian night deserves a quick check for a BoJ announcement, a Japanese macro print, or simple contagion from the prior Wall Street session. Leverage on index CFDs often runs high, so managing your leverage becomes even more critical on a market that can gap hard at the session open.
The Nikkei's volatility also means your position sizing needs to flex with the moment (our Nikkei 225 market page gives the average range of its sessions over a year). A fixed lot size that felt fine on a quiet Tuesday can turn into an outsized risk the night the BoJ surprises everyone. That's exactly where a dynamic risk approach earns its keep over a rigid one, because the instrument's own volatility regime keeps shifting under your feet.
Common mistakes traders make with Japanese indices
The most frequent error: treating the Nikkei like just another index on a watchlist, interchangeable with the S&P 500 or the DAX. It isn't. Its price-weighting quirk, its tight yen correlation and its unusual trading hours make it behave differently enough that copy-pasting a strategy built for US indices often backfires. You'll see traders place a breakout trade on the Nikkei using the same rules they use on the Nasdaq, then get blindsided by a yen-driven reversal that had nothing to do with chart patterns.
Another recurring mistake is ignoring the overnight gap risk. Because Tokyo trades while most Western traders sleep, a position left open without a stop can open the next morning far from where you left it. Add to that the BoJ's occasional surprise interventions, and you get a market where discipline around stops matters even more than usual. If you've ever been caught by a gap you didn't see coming, you already know how fast a well-planned trade can turn into a forced exit.
How Tradoshi helps you
None of this theory means much if you can't see how it plays out in your own trading. Tradoshi's trading journal lets you log every Nikkei or TOPIX trade, whether it came in through a CFD broker, MT4, MT5, cTrader or a manual entry, so you stop relying on memory to judge how you actually perform on Japanese indices versus other markets.
Because volatility on these indices can spike fast around BoJ decisions or sharp yen moves, Tradoshi's position size calculator and customizable risk rules help you keep your percent-of-capital risk consistent even when the instrument itself gets jumpy. The statistics module then breaks down your win rate, profit factor, expectancy and R-multiple specifically for the trades you tag, so you can see whether your Nikkei trades genuinely pull their weight or just add noise to your equity curve.
And since context matters so much here (a BoJ statement, a violent yen swing, an overnight gap) you can use free labels you choose and your own notes in the Trade Review section to mark what was actually happening around each trade. Tradoshi won't detect that context for you automatically, but once you've tagged it yourself, the trade replay and debrief make it far easier to spot whether you're consistently trading Japanese indices well or just gambling on a macro story you don't fully control.
Reading the index without trading it
Even if you never place a single CFD on the Nikkei, both indices work as a useful macro gauge. A steadily climbing TOPIX alongside a weakening yen tells a coherent story about export-driven optimism. A Nikkei that keeps rallying while the TOPIX lags suggests the move is concentrated in a few high-priced names rather than broad-based strength, exactly the kind of divergence worth noticing before you assume 'the Japanese market is up' means something uniform.
Plenty of global macro traders watch the Nikkei purely as a sentiment proxy for Asian risk appetite overnight, without ever holding a Japanese position. If the Nikkei sells off hard during the Asian session, it often colors how European indices open a few hours later, especially on days with no major European data of their own. Treating it as an early signal, rather than a market you must actively trade, is a perfectly legitimate way to use it.
Frequently asked questions
What is the main japanese stock market index?
The Nikkei 225 is the most widely quoted one, but the TOPIX is considered more representative of the broader Japanese equity market because of its float-adjusted weighting.
Why is the Nikkei 225 price-weighted instead of cap-weighted?
It dates back to 1950, when the Tokyo Stock Exchange launched it as an adjusted price average. The method stuck when the Nikkei group took over the calculation in 1970, even though it creates distortions compared to modern cap-weighted indices.
How strong is the link between the yen and the Nikkei?
It's a recurring pattern rather than a fixed rule. A weaker yen tends to help Japanese exporters' reported profits, which often lifts the index, while a sharply stronger yen tends to weigh on it.
Can I trade the Nikkei 225 outside Japanese market hours?
Yes, most brokers offer Nikkei CFDs or futures that quote near continuously, which means you can see moves overnight even while the Tokyo exchange itself is closed.
Is TOPIX a better choice than the Nikkei 225 for a long-term view?
For gauging the overall health of Japan's economy, yes, since it covers far more companies and weights them by actual market value rather than share price.
Does the Bank of Japan directly influence these indices?
Yes, heavily. Its interest rate stance and interventions affect the yen, which in turn affects exporter profitability and investor sentiment toward both indices.
What is the JPX-Nikkei 400?
It's an index launched in 2014 that selects 400 companies based on return on equity and governance quality, designed partly to encourage better shareholder treatment among Japanese firms.
Should a beginner trade Japanese indices?
It's doable, but the unusual trading hours, yen sensitivity and price-weighting quirks mean you should understand the mechanics first rather than trading it like a familiar Western index.
How does sector composition differ from the S&P 500?
Japanese indices carry heavier weights in industrials, financials and export-driven manufacturing, with less concentration in large-cap technology than you'd find in the Nasdaq or S&P 500.
What is the safest way to get exposure without active trading?
ETFs replicating the Nikkei 225 or TOPIX, available on several global exchanges, suit a buy-and-hold approach far better than leveraged CFDs or futures.