 By Benjamin Roure L'Hermitte
The risk/reward ratio compares what you risk to what you aim for on a trade: the distance from your entry to your target, divided by the distance from your entry to your stop. It's simple to compute and easy to misread, because it says nothing on its own: a ratio only becomes information next to how often the target is actually reached. This guide redoes the math, separates the planned ratio from the realized one, and says what the studies we read actually measured about how people cut their gains.
- The formula: ratio = distance to target ÷ distance to stop. Stop 20 pips away, target 40 pips away: 1:2.
- The breakeven point, before costs: 1 ÷ (1 + ratio). At 1:2 you need 33.3% winning trades to stop losing; at 1:1, 50%.
- Ratio and win rate are read together: a more distant target is hit less often, and no study we read establishes a 'good' ratio.
- What matters is the realized ratio, measured in R on your closed trades, costs and slippage included, not the one on the plan.
The risk/reward ratio compares what you risk to what you aim for on a trade. If you risk 100 to target 200, your ratio is 1 to 2. Two mistakes keep coming back in how it's used: reading it alone, without the win rate that goes with it, and writing a 1:5 on the plan without knowing how often price goes that far.
Understanding it changes how you judge your trades: you stop trying to 'be right' and start hunting for favorable asymmetries. This guide breaks down what the ratio really means, why it transforms your profitability, its mechanical link with win rate, the gap between planned and actual ratio, and how to measure it honestly instead of kidding yourself.
What the ratio really means
The risk/reward ratio is the relationship between two price distances: the one separating you from your stop loss (what you risk) and the one separating you from your target (what you aim for). Ratio = distance to target ÷ distance to stop. If your stop is 20 pips away and your target 40 pips away, 40 ÷ 20 is 2: your ratio is 1:2. It's a measure of asymmetry: it tells you how much you make per unit of risk when the trade works, and nothing else.
The word 'reward' is misleading: it isn't a guaranteed gain but a potential one, the gain you'll get if price reaches your target before your stop. A 1:3 ratio doesn't mean you'll make three times your stake, it means that if this trade wins, it will make three times what a losing trade cost you. That nuance is crucial for everything that follows.
These two distances correspond to two orders placed before entry. What each one guarantees, and what it does not, is explained in the guide to take profit and stop loss.
Why it changes your profitability
A good ratio lets you lose more often than you win while staying profitable. With a 1-to-2 ratio, you can be wrong 6 times out of 10 and still make money, before costs: your four winners at +2 bring 8 units, your six losers at −1 cost 6, leaving you +2, or +0.2 per trade. It's liberating, because it breaks the obsession with being right.
The opposite tendency has been measured, at least among stock investors. On 10,000 accounts at a large US discount brokerage, followed from 1987 to 1993, Terrance Odean's study, Are Investors Reluctant to Realize Their Losses?, finds that these investors realized 14.8% of the gains they could have taken against 9.8% of the losses: they sold their winning stocks more readily than their losing ones. That is the disposition effect, which the paper defines as the tendency to hold losing investments too long and sell winning investments too soon. These are retail investors in stocks, not intraday traders, but it is exactly the mechanism that builds, trade after trade, an inverted ratio: gains cut small, losses left whole.
The inseparable link with win rate
Ratio and hit rate are two sides of the same coin: neither means anything on its own. A high win rate with a bad ratio can perfectly well lose money; a low win rate with a good ratio can make it steadily. What decides is their combination, which we call expectancy.
Every ratio has its breakeven point, the win rate below which the series loses. It follows from one line: at breakeven, wins exactly offset losses, so p × ratio = (1 − p) × 1, hence p = 1 ÷ (1 + ratio). The calculation assumes every winning trade returns exactly the ratio, every losing trade costs exactly 1, and there are no costs or slippage. Here are the benchmarks:
| Risk/reward ratio | Breakeven win rate, before costs | What it means |
|---|---|---|
| 1:1 | 50% | One winning trade in two, just to avoid losing |
| 1:1.5 | 40% | Four in ten |
| 1:2 | 33.3% | One in three |
| 1:3 | 25% | One in four |
| 1:5 | 16.7% | One in six, if the target is hit that often, which nothing guarantees |
For a 1:2, that's 1 ÷ 3, or 33.3%. Above that rate the series wins; below it, it loses. Above all, remember the logic: the higher your ratio, the more often you can afford to lose, but only under one condition the table doesn't show.
The unrealistic-ratio trap
Aiming for huge ratios (1:8, 1:10) sounds brilliant: the formula says a 1:10 stops losing from a 9.1% hit rate. The problem is that win rate isn't independent of ratio. The further your target, the more chances price has to reverse before reaching it: on the same trade, a 1:10 target is, by construction, hit less often than a 1:2 one. How much less often, no formula says: only your trade history measures it.
In other words, you don't choose your ratio and your win rate separately: when you move the target further, you lower how often it gets hit. So the best ratio isn't the biggest, it's the one that gives the best expectancy on your market and your method, and none of the studies read for this guide establishes a ratio valid for everyone. The benchmarks that circulate, 'never below 1:2', 'aim for 1:3', are traders' conventions, not measured results.
At 1:10 with a 5% hit rate, expectancy is −0.45 R per trade. At 1:2 with 45%, it is +0.35 R. The most flattering ratio is not the most profitable one.
Planned ratio versus realized ratio
The ratio you write on your plan before entering, the planned ratio, is not the one you realize. Three things separate them. Your exits: you cut a +3 trade at +1, you move your stop 'just a little', you let a gain drift back to entry. Slippage: according to the SEC's investor bulletin on stop, stop-limit and trailing stop orders, the stop price is not a guaranteed execution price; once reached, the order becomes a market order, filled at whatever price the available liquidity offers at that moment, which can deviate significantly from the level you set. A loss planned at −1 R can therefore come out larger. And costs, covered below. In all three cases, the gap runs the same way: against the ratio.
That's why judging your trading on intentions is useless. A 1:3 plan executed like a 1:1 is a 1:1 plan. The only data that counts is the average ratio of your actually closed trades: what you thought you held and what you actually held are two numbers, and only the second can be measured.
Placing your orders in advance helps you stick to the plan, and that has been tested. In the laboratory experiment by Fischbacher, Hoffmann and Schudy on stop-loss and take-gain orders, participants who could program automatic sales showed a significantly smaller disposition effect than the other group, because they realized more of their losses; the proportion of winners realized was similar in both groups. It is a laboratory result, not a measurement on real accounts, and it concerns the loss side: a stop placed in advance helps you accept a loss, it does not guarantee you will let a gain run to the target.
How to set a reachable ratio
A good ratio isn't decided at random or out of ambition. It's derived from your method and verified on your data. Here's the healthy approach:
- Place your stop where your thesis is invalidated, never at an arbitrary distance chosen to 'make a nice ratio'.
- Place your target on a real market level (support, resistance, liquidity), not on a theoretical multiple of your risk.
- Compute the resulting ratio. If it's bad, don't cheat on the stop: skip the trade.
- Measure your average realized ratio and your real win rate on your closed trades, then check that expectancy is positive, keeping in mind the uncertainty quantified right after.
- Adjust your method, not your numbers: if the real ratio is too low, the problem is in your exits, not in your spreadsheet.
The fourth point deserves a number, because a win rate measured over few trades is very uncertain. With the Wilson method, as presented in the NIST statistics handbook, from the US standards institute, a 50% rate observed over 30 trades sits, at 95% confidence, between roughly 33% and 67%; over 100 trades, between 40% and 60%. At 1:2 the threshold is 33.3%: thirty trades are therefore not enough to say whether you are above or below it. A method's expectancy is judged over hundreds of trades, not over one good week.
Thinking in R: the right unit
The cleanest way to use all this is to measure your trades in R. The definition comes from Van Tharp: in the Van Tharp Institute's lesson on R and R-multiples, R is the initial risk taken in a position, as defined by the initial stop loss, and every result is expressed as a multiple of that risk. A trade that wins twice your risk is +2 R; a stopped-out trade is −1 R; a trade cut halfway is +0.5 R. Thinking in R, you compare all your trades on the same scale, whatever their size.
That initial risk in money is also the starting point of the position size calculation: the same amount at risk, converted into lots or shares according to the stop distance.
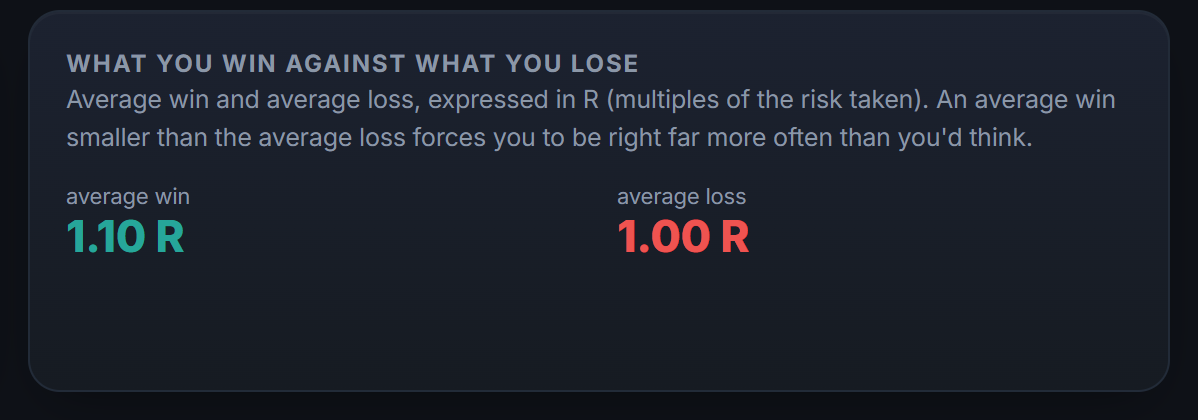
R turns the ratio from an intention into a measurement. Instead of saying 'I aim for 1:2', you can say 'my average realized R is +0.6 over my last 40 trades', +24 R in total. That average R, losses included, is what the same lesson calls expectancy: the average R-multiple your method returns per trade. That's a concrete number, comparable over time, that tells you whether you're improving or kidding yourself. Add up your R over a period and you get your performance directly in units of risk, independent of your position size.
Classic mistakes to avoid
- Judging the ratio alone: a ratio without a win rate says nothing. Always read both together.
- Tightening the stop or pushing the target further to 'make a nice ratio': the number goes up, but a stop inside the noise gets hit more often and a further target is reached less often. The ratio changes, expectancy doesn't.
- Aiming too far: a target that is rarely reached costs more than a modest ratio held to the end.
- Moving the target mid-trade: every time you cut a winner early, you degrade your realized ratio.
- Never measuring the realized side: without data on your closed trades, your ratio is just an opinion.
The ratio varies by trading style
There's no universal ideal ratio, because the right ratio depends on the method. The breakeven table reads both ways. A method that hits its target often because it is close, like scalping, can live with a modest ratio, around 1:1, provided it wins more than one trade in two. A method that lets long moves run and misses often, like trend following, needs a high ratio so that its rare gains pay for its many small losses. Both can win, with opposite ratios, and what each style actually realizes can only be read in its trades.
The mistake would be to slap a 'recommended' ratio onto your method without regard for its nature. A scalper forcing themselves to aim for 1:3 would see their targets hit far less often; a trend follower cutting at 1:1 would kill their edge. The right ratio isn't a magic number, it's the one that fits your style and that your data confirms as profitable. Start by understanding how you win, then calibrate your ratio accordingly, never the reverse.
The ratio isn't fixed during the trade
The ratio you compute at entry is only a starting point, not a rigid constraint for the trade's whole life. As price moves, the relationship between what is left to gain and what can still be lost changes. Take a trade entered at 1:3, stop at −1, target at +3, and price now at +1.5. With the stop unchanged, 1.5 is left to gain against 2.5 to lose: 0.6 to 1. With the stop moved to entry, 1.5 is left against 1.5: 1 to 1. In both cases the question is no longer the one you had at entry, and managing that evolution is part of the craft.
That's where tools like moving to breakeven (shifting your stop to entry once a certain profit is reached) or partial exits (securing part of the gain while letting the rest run) come in. These techniques let you adjust the risk/reward profile along the way without ever moving a stop against yourself. Handled well, they improve your realized ratio; handled badly, they make you cut too early. The rule stays the same: decide these adjustments cold, in your plan, never under the sting of emotion. What moving to breakeven removes in risk and what it costs in trades closed at zero is detailed in the guide to break-even in trading.
Ratio and transaction fees
Costs erode your real ratio. The spread, commissions and, on some products, financing add to your loss and subtract from your gain. Take a stop 20 pips away, a target 40 pips away and a round-trip cost of 2 pips, spread and commissions included: the net gain is 38 pips, the net loss 22, and the real ratio drops from 2 to 1.73. The breakeven point rises from 33.3% to 36.7%. On a short trade, the same 2 pips weigh far more: with a 5-pip stop and a 10-pip target, the real ratio is only 1.14 and the threshold climbs to 46.7%, enough to flip a method from profitable to losing. The calculation assumes a fixed cost per trade; a spread that widens at the moment you exit makes it worse, not better.
It's one more reason to measure your realized ratio on your actually closed trades, costs included, rather than trusting your plan's theoretical ratio. The ratio that counts isn't the one you had in mind at entry, it's the one that appears in your account after everything has been paid. The breakeven point with costs included, for a trade and for a system, is worked out in the guide to break-even in trading.
Measuring it automatically with Tradoshi
Computing your real R by hand is tedious and error-prone. Tradoshi does it for you: it reads your stop loss from your orders and derives your R-multiple on every trade, without you entering anything. You see your realized ratio, not the one you imagined.
- Automatic R-multiple: your initial risk is read from your stops, your R is computed on every closed trade.
- Average realized ratio: you see at a glance whether your exits keep their promises or betray them.
- Crossed with win rate: ratio and hit rate are shown together, never one without the other.
- Tracked over time: your average R per period shows you whether you're truly improving.
Frequently asked questions
Can a 1:1 ratio be profitable?
Yes, provided you have a win rate above 50%, before costs. The ratio is never judged alone: it's the combination of ratio and win rate that determines expectancy. A 1:1 at 55% returns +0.10 R per trade; the same at 45% returns −0.10 R.
What's a good risk/reward ratio?
None of the studies read for this guide establishes a ratio valid for everyone, and the benchmarks that circulate, 'never below 1:2', 'aim for 1:3', are conventions, not measurements. Every ratio sets a breakeven win rate, 1 ÷ (1 + ratio), and a more distant target is hit less often: the right ratio is the one your trades actually hold, costs included, with a positive expectancy.
Why does my win rate drop when I aim further?
Because the further your target, the more chances price has to reverse before reaching it. A 1:5 target is mechanically hit less often than a 1:2 one. That's the fundamental trade-off between ratio and hit rate: you can't maximize both at once.
What exactly is an R?
1 R is your initial risk on a trade, the distance between your entry and your initial stop, expressed in money: that is the Van Tharp Institute's definition, which expresses every result as a multiple of that risk. A +2 R gain means you made twice what you risked. Thinking in R lets you compare trades of different sizes on the same scale.
Are planned and actual ratios often different?
They only coincide if you exit exactly at the target or exactly at the stop, with no costs or slippage. An early exit, a moved stop, a stop order filled beyond its level, and the realized ratio drifts from the planned one, in the wrong direction. That's why measuring your real R, from your executed trades, is far more useful than the ratio you had in mind at entry.
Should I tighten my stop to improve my ratio?
No. Tightening the stop raises the displayed ratio, but places it inside the market's normal noise, where it gets hit more often: the win rate drops with it. Widening it does the opposite: the ratio drops, and the loss in money grows if the position size doesn't shrink. The stop goes where your thesis is invalidated; if the resulting ratio is bad, the right answer is to skip the trade.
How do I compute a ratio's breakeven point?
Breakeven = 1 ÷ (1 + ratio), before costs. For a 1:2, that's 1 ÷ 3, or 33.3%; for a 1:3, 25%. Above that win rate you win, below it you lose. With costs included the threshold rises: with a stop 20 pips away, a target 40 pips away and 2 pips of round-trip costs, it moves to 36.7%.
How many trades do I need to know my win rate?
More than you think. With the Wilson method, a 50% rate measured over 30 trades sits, at 95% confidence, between roughly 33% and 67%; over 100 trades, between 40% and 60%. Over thirty trades, you therefore don't know whether you are above or below the threshold of a 1:2. Measure over hundreds of trades before concluding.