 By Benjamin Roure L'Hermitte

Risk management in trading is the set of rules that fix, before every trade, what you can lose without damaging your capital: a risk percentage, a computed position size, a stop placed where your idea is wrong, a daily loss limit and a maximum drawdown decided cold. A trader who wins often can still torch his account, and a trader who loses often can stay profitable for years: the difference lies in those rules, not in talent. This guide is the pillar of the series: it sums up each building block, with the figures recomputed and the sources read, and points to the guide that covers it in depth.
- Position size matters more than the setup itself: it is computed from your risk and your stop distance, never the other way around.
- Risk is a percentage of current capital: 0.5% to 1% per trade is a traders' convention, not a regulator's rule.
- Drawdown isn't an accident: at a 50% win rate, five losses in a row have an 81% chance of showing up within a hundred trades.
- Discipline outweighs strategy: the best method in the world doesn't survive badly managed risk.
Why risk management comes before strategy
A strategy tells you when to enter. It never tells you how much to risk, and that's where everything actually gets decided. With 55% winning trades, a win equal to the loss and a fixed stake, the gambler's ruin formula, proved in Karl Sigman's course notes on the gambler's ruin problem, at Columbia University, gives the probability of ending at zero while playing indefinitely: (q ÷ p) to the power k, where k is the number of stakes your capital holds. Risking 10% of the starting capital per trade, ten stakes, it comes to 13%; at 5%, 1.8%; at 1%, under 0.000001%. Same edge, three fates.
It's counterintuitive at first. Everyone wants the perfect setup, the magic indicator, the pattern that never fails. But the market will hand you losing streaks, sometimes long, with zero warning, and that can be computed: with 55% winning trades drawn independently, the probability of meeting at least eight losses in a row is about 8% over a hundred trades and 37% over five hundred. The one variable you fully control is how much you put on the table each time you pull the trigger. Everything else, you simply absorb.
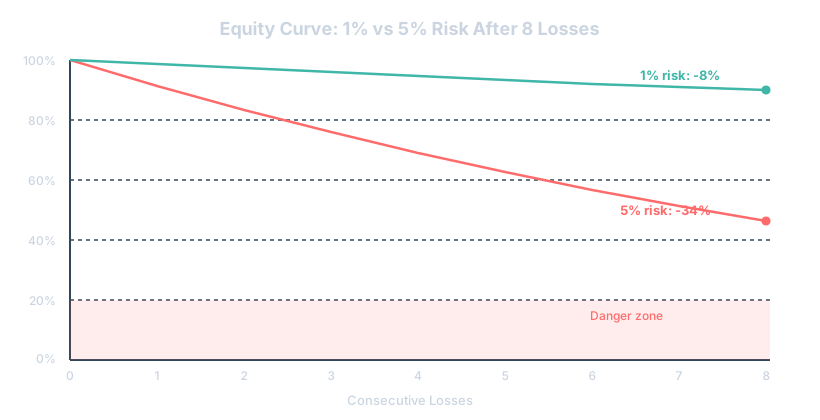
Take a simple example. Two traders run the exact same strategy on the same instrument. The first risks 1% of current capital per trade. The second risks 5%. Over a stretch of eight consecutive losses, the first trader is down 7.7% of capital, and an 8.4% gain erases it. The second is down 33.7%, and now needs a 50.7% gain just to get back to the starting point. Same strategy, same market, two fates. The numbers only show up once the trades are closed and counted, which is what post trade risk management is for: checking what each trade really cost against what the rule allowed. How this calculation turns into a probability of losing everything is detailed in the guide to risk of ruin.
The risk percentage: the non-negotiable baseline
The first rule, the most basic and yet the most ignored: never risk a fixed dollar amount, always a percentage of your current capital. If you start with 10,000 and risk 100 per trade because 'that's 1%', fine, but recalculate that percentage every time your balance moves. If your account drops to 8,000, your 1% becomes 80, not 100. Obvious on paper. Mid-tilt after a loss, that recalculation doesn't happen on its own.
How much should you risk exactly? There is no proven number, and no regulator sets one: the 0.5% to 1% per trade guideline is a traders' convention. Van Tharp's trading concepts present it on a 100,000 portfolio where you decide to risk only 1% on a trading idea, 1,000, and call position sizing the part of your trading system that tells you 'how much'. The one published formula that says how much to bet is the Kelly criterion, in J. L. Kelly's 1956 paper, A New Interpretation of Information Rate; it requires knowing your edge precisely, and Edward Thorp, in his chapter on the Kelly criterion, writes that overbetting is much more severely penalized than underbetting. A small fixed percentage is a heavily reduced version of that idea.
What the percentage costs can be computed: ten losses in a row remove 4.9% of capital at 0.5% per trade, 9.6% at 1%, 18.3% at 2% and 40% at 5%. The real challenge isn't finding THE perfect percentage, it's picking a small one and sticking to it. Fixed risk or risk adjusted to context, and why the first stays the baseline until your track record is long and profitable, is the subject of money management: fixed or dynamic risk.
- Risking too little slows the growth of a small account, but it never puts the account in danger.
- Risking too much turns every loss into an emotional catastrophe, and a normal losing streak into a hole you don't climb out of.
- The right percentage is the one you can hold even after five losses in a row without changing your behavior.
Calculating position size: the step that gets rushed
Here's the classic scene. A trader decides to risk 1% of his account, so 100 on a 10,000 balance. He opens his chart, sets a stop loss 50 pips from entry, and takes the same size as usual, 0.5 lot, because calculating takes thirty seconds he doesn't feel like spending. At 10 per pip per lot, he just risked 250 instead of 100, without even noticing.
The math fits on one line: size = (capital × risk percentage) ÷ (stop distance × point value). On the example, 100 ÷ (50 × 10) gives 0.2 lot. Size changes on every trade, because the stop distance changes; the amount risked stays constant. It's the bridge between your strategy and your real account, and the same calculation holds on forex, futures, stocks and crypto, only the point value changes: the full method, market by market, is laid out in the guide to calculating position size.
Keeping the same lot size as yesterday no matter where today's stop sits means risking very different amounts for no reason. And leverage changes nothing here: it sets the margin your broker locks up, 1 divided by the leverage, not the loss if the stop is hit.
The stop loss: where it really goes, and why you keep moving it
A stop loss isn't a box you tick to feel responsible. It's the border between a trade you control and a trade that controls you. The trap is placing it on an arbitrary number, 'I risk 20 pips because that's what I always risk', without asking whether market structure actually justifies that distance.
A good stop loss sits at the point where, if price reaches it, your trade idea is objectively invalidated. Not where you feel comfortable. Not wherever your position size happens to keep you under 1%. At the logical market level, a broken support, a structure that failed, a key level taken out, with a margin for noise. Then you adjust your position size to respect your risk, never the other way around. The four ways of setting the distance, and the round-number trap, are in the guide on where to place a stop loss.
And a stop doesn't guarantee the exit price. According to the SEC's investor bulletin on stop, stop-limit and trailing stop orders, the stop price is a trigger: once reached, the order becomes a market order, filled at whatever price the available liquidity offers at that moment, which can deviate significantly from the level set. What the stop and the profit target each guarantee, and how to set both before entering, is explained in the guide to take profit and stop loss.
And then there's the other problem, even more destructive: dragging the stop mid-trade. Price gets close, the discomfort builds, and the finger slides the stop a little further 'to give it room'. That's exactly the mechanism that turns a small planned loss into a disaster. That tendency has been measured, at least among stock investors: on 10,000 accounts at a large US discount brokerage, followed from 1987 to 1993, Terrance Odean's study, Are Investors Reluctant to Realize Their Losses?, finds that those investors realized 14.8% of the gains they could take against 9.8% of the losses. That's the disposition effect, measured on retail stock investors, not leveraged traders: check in your journal whether you do the same.
Risk/reward ratio: never trade without it in mind
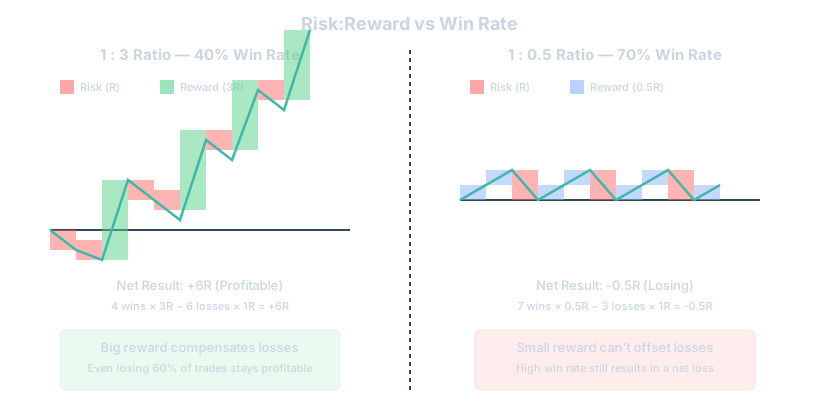
Risking 1% per trade means nothing if you don't know what you're hoping to gain on the other side. The risk/reward ratio is the distance to the target divided by the distance to the stop. A 1:2 ratio means you risk 1 to target 2. Each ratio has its break-even win rate before fees, 1 ÷ (1 + ratio): 50% winning trades at 1:1, 33.3% at 1:2, 66.7% at 1:0.5. At 1:2, you can therefore be wrong six times out of ten and still come out ahead: four wins at +2 and six losses at −1 leave +0.2 per trade.
Two ideas get mixed up easily. A favorable ratio guarantees nothing on its own if your win rate is too low, and a great win rate saves nothing if your losses dwarf your wins. A more distant target is, by construction, reached less often, and no study read for this series establishes a 'good' ratio valid for everyone: the only one that counts is the realized ratio, measured in R on your closed trades, fees included. The detail is in risk/reward ratio explained simply.
The figure that settles it is the profit factor, the total of your gains divided by the total of your losses: above 1, the system made money over the period, and that is the only documented threshold, 1.5 and 2 being conventions. It must be read with care on few trades: with the Wilson interval presented in the NIST engineering statistics handbook, a 50% win rate measured on 30 trades sits, at 95%, between 33% and 67%; on 100 trades, between 40% and 60%; it takes 400 trades to narrow it to 45% to 55%. Why one flatters and the other tells the truth about the account is explained in win rate vs profit factor, and the full reading of the indicator in profit factor explained.
Drawdown: it's not a question of if, it's a question of when
Here's a truth nobody likes hearing early on: you will go through a drawdown. Not maybe. Certainly, and it can be computed: at a 50% win rate with independent trades, a run of at least five consecutive losses has about an 81% chance of appearing within 100 trades, and a run of at least seven about 32%. The question isn't whether to avoid it, it's how far you're willing to let it go before you change something. A trader with no drawdown plan discovers his tolerance limit at the worst possible moment, mid losing streak, judgment already warped by stress. What a drawdown is, why it is inevitable and how to get through one without making it worse is the guide to drawdown: understanding and surviving your dips.
The maximum drawdown you're willing to accept has to be decided cold, before you trade, not during. Recovery is non-linear: after a 10% drop, it takes an 11% gain to get back to the peak; after 20%, 25%; after 30%, 43%; after 50%, 100%. If you set a 15% limit before cutting size or switching back to demo, that decision has to exist on paper before the first loss, otherwise it never shows up at the right moment. That's the whole point of the guide to maximum drawdown, your most important number.
You also need to grasp the underlying math, what's called the risk of ruin. The higher your risk per trade, the higher the probability of losing everything, and not linearly: doubling the risk per trade amounts to taking the square root of the probability of ruin, which goes from 1.8% at 5% per trade to 13% at 10%, then 37% at 20%. This isn't abstract theory, it's calculable, and the formula, the Monte Carlo simulation and the prop firm case live in risk of ruin: the math you need to know.
Daily limits: your most effective safety net
Here's a simple rule that protects an account better than any sophisticated strategy: decide in advance how many losses, or what daily loss percentage, closes your laptop for the day. It's not a punishment, it's protection against a reflex measured among professionals. According to Coval and Shumway's study in the Journal of Finance (2005), proprietary traders at the Chicago Board of Trade who lose in the morning are about 16% more likely to take above-average risk in the afternoon than those with morning gains. That result holds for those traders, not for you at your screen, but it describes the slope: it's exactly the ground where revenge trading grows.
On a prop firm account, that constraint is written by the firm. At FTMO, according to its trading objectives page, the maximum daily loss is 5% of the initial capital on the 2-Step model and 3% on the 1-Step, recalculated every day at midnight Central European time, and it is equity, open positions included, that must not fall below it; each firm has its own formula, and it changes. Even without a prop firm, setting yourself a daily budget deliberately below any limit changes everything. How the limit is computed and how to build your margin below it is covered in daily loss limit: how to actually respect it, the rule of stopping after a set number of consecutive losses in risk management in day trading, and the maximum loss that follows your highest balance in the trailing drawdown in prop firms.
What makes this rule hard isn't understanding it. It's applying it in the moment, when your brain is already convinced the next trade will fix everything. That's precisely why it needs to exist before the emotional moment, written down, non-negotiable, almost boring in its rigidity. Boring rules are the ones that actually work.
Leverage and correlation: the risks you don't see coming
Two traps slip under the radar even when risk per trade is handled well. The first is leverage. It doesn't change your risk directly: the margin locked up is 1 divided by the leverage, 3.33% of the position at 30:1, and your loss if the stop is hit depends on your size and your stop distance, not on the multiplier. For a retail client that leverage isn't free either: ESMA's statement of 27 March 2018 capped the leverage of CFDs sold to retail clients in the European Union, from 30:1 on major currency pairs to 2:1 on cryptocurrencies, requires providers to close out positions when the account's funds fall to 50% of the required margin, and notes, from national regulators' analyses, that 74% to 89% of retail accounts lose money on these products. In France, the AMF's 2014 study counts more than 89% losing clients among 14,799 active CFD and forex clients over four years. Those figures cover leveraged products sold to retail clients, not all traders. The real danger is sizing your position from the available leverage rather than from your risk, a distinction covered in managing leverage without burning yourself.
The second trap, sneakier still, is correlation between positions. You open three different trades thinking you're diversifying, but if the three instruments move the same way when the market stresses (two correlated forex pairs, or several stocks from the same sector), you don't have three independent positions. You have one position tripled in size, and a risk of ruin close to that of a trader risking 3% on a single trade. The cap on total risk, per market idea and in simultaneous positions, is covered in the section on portfolio-level risk management of the money management guide, and it's worth an honest look at your open trades right now.
Risk management in day trading: a world of its own
Day trading brings its own risk constraints, different from swing or position trading. The frequency of trades mechanically multiplies the opportunities to get the risk wrong, and the speed of execution leaves far less room for thought. If you risk 1% per trade and take ten losing trades in a bad day, you lose 9.6% of the account, far more than your risk per trade suggested: unit risk and the daily limit have to be thought through together.
The guardrails specific to day trading include a daily loss limit, a stop after a run of close losses, attention to the fees that frequency multiplies, and particular vigilance about overtrading, the reflex of stacking positions to 'make up' lost time or money. It is a specific enough subject to deserve its own guide, risk management in day trading: essential guardrails.
Building risk rules you'll actually follow
Knowing the theory is one thing. Following your own rules under pressure is an entirely different skill, and it's the one that actually separates consistent traders from everyone else. You can write the perfect risk plan on a Sunday evening and abandon it completely by Tuesday afternoon after two losses in a row. That gap between knowing and doing is where most accounts actually die.
This is exactly why tracking your discipline matters as much as tracking your profit and loss. Did you respect your risk percentage today? Did you move your stop? Did you size the position correctly before entering? These are yes or no questions, and answering them honestly, trade after trade, builds the kind of self-awareness that no strategy tweak ever will.
How Tradoshi helps you
Risk management only works if you can see it clearly, trade after trade, without guessing. Tradoshi's journal imports your trades automatically from MT4, MT5, cTrader or your crypto exchange, or lets you log them manually, so every position you've taken is recorded with its real risk, not your memory of it. From there, the statistics module surfaces your win rate, profit factor, expectancy, R-multiple and the overall Oshi Score, giving you a concrete read on whether your risk approach is actually working over time, not just on your best week.
On the risk side specifically, Tradoshi lets you set the percent of capital you risk per trade, use the position size calculator so you stop eyeballing your lots, build customizable risk rules that match your own limits, and check a daily risk calendar before you open your platform. And because knowing your rules isn't the same as following them, the discipline score measures specifically how well you stick to your own plan, trade after trade, which is often where the real leak in a trading account hides.
For the emotional side of risk, an emotional check-in before you trade and the emotion / performance link analysis help you notice if your risk-taking changes when you're stressed, tired or overconfident. And when you want to actually learn from a specific trade, Trade Review lets you replay it, debrief with the emotion you felt, tag it with labels you choose yourself, and check whether you truly followed your plan. None of this replaces your judgment. It just makes sure your risk decisions are visible instead of buried in a spreadsheet you never open.
Putting it all together: a simple risk framework
You don't need twenty rules. You need four or five that you never break. Something like this: risk a fixed percentage of current capital per trade, decided in advance and recalculated as your balance moves. Place your stop by structure, not by comfort. Never take a trade whose risk/reward doesn't meet your minimum threshold. Set a daily loss limit that closes your session once hit. And define, on paper, the drawdown level that triggers a pause or a strategy review.
Nobody follows this perfectly every single day. That's not the goal. The goal is that when you break a rule, you notice it, you write it down, and you correct course before it becomes a pattern. The traders who last aren't the ones who never make a risk mistake. They're the ones who catch it fast and don't let one bad decision cascade into three more.
| Risk element | Common usage (a convention, not a measured threshold) | What the arithmetic says |
|---|---|---|
| Risk per trade | 0.5% to 1% of current capital; 1% in Van Tharp's example | Ten losses in a row cost 4.9% at 0.5% and 9.6% at 1% |
| Risk/reward ratio | Set by your method, never by ambition | Break-even win rate before fees: 1 ÷ (1 + ratio), 33.3% at 1:2 |
| Daily loss limit | A budget below any firm's limit, translated into a number of losses | At 1% per trade, ten losing trades in a day cost 9.6% |
| Max drawdown threshold | Decided in advance, in writing | After −20% it takes +25% to recover, after −50%, +100% |
Frequently asked questions
What percentage of my capital should I risk per trade?
No percentage is proven valid for everyone, and no regulator sets one: 0.5% to 1% of current capital is a traders' convention, and 1% is the figure the Van Tharp Institute uses in its example. What can be computed is the cost of a streak: ten losses in a row remove 4.9% of the account at 0.5% per trade, 9.6% at 1%, 18.3% at 2% and 40% at 5%.
Is risk management more important than strategy?
In practical terms, yes. A mediocre strategy with tight risk control can survive for years. A great strategy with poor risk control eventually blows up, because losing streaks are guaranteed, not optional: at a 50% win rate, five losses in a row have about an 81% chance of appearing within a hundred trades.
How do I calculate position size correctly?
You need your capital, your risk percentage, and the distance between entry and stop loss in pips or points: size = (capital × risk percentage) ÷ (stop distance × point value). From those three numbers, position size follows mechanically instead of being guessed.
Should I move my stop loss if the trade is going against me?
No. Moving a stop loss because price is approaching it defeats its entire purpose. If the level was chosen correctly by market structure, moving it just delays and often enlarges the loss.
What is drawdown and why should I plan for it in advance?
Drawdown is the decline from your account's peak value. It's mathematically inevitable, not a sign of failure. Planning your maximum acceptable drawdown before it happens keeps you from making panicked decisions mid-crisis, and the arithmetic of recovery is why: after a 50% drop it takes a 100% gain to get back to the peak.
How does correlation between trades increase my risk?
If several open positions move for the same underlying reason, like multiple pairs betting against the same currency, their combined risk is higher than the sum of each individual trade's stated risk.
Should I use the same risk percentage on every setup?
Keeping it fixed is the safest default, and the one to keep until your own data proves a setup has a clearly superior expectancy. What matters most is having a rule and following it, not the exact number itself.
What's a healthy daily loss limit?
A common usage is stopping after two to three consecutive losses, or after a fixed percentage drop in a single day, whichever comes first, and on a prop firm account keeping that budget well below the firm's own limit. The exact number matters less than actually respecting it.
Can good risk management make up for a weak strategy?
It can prevent ruin, but it can't manufacture profitability out of nothing. Risk management protects your capital while you refine or replace a strategy that isn't producing a real edge.
How do I know if my risk management is actually working?
Track it over enough trades to matter, hundreds rather than dozens: your drawdown stays within your planned limits, your losing streaks don't force emotional decisions, and your account survives rough patches without requiring a full reset.